Open Access
Fig. 3
Download original image
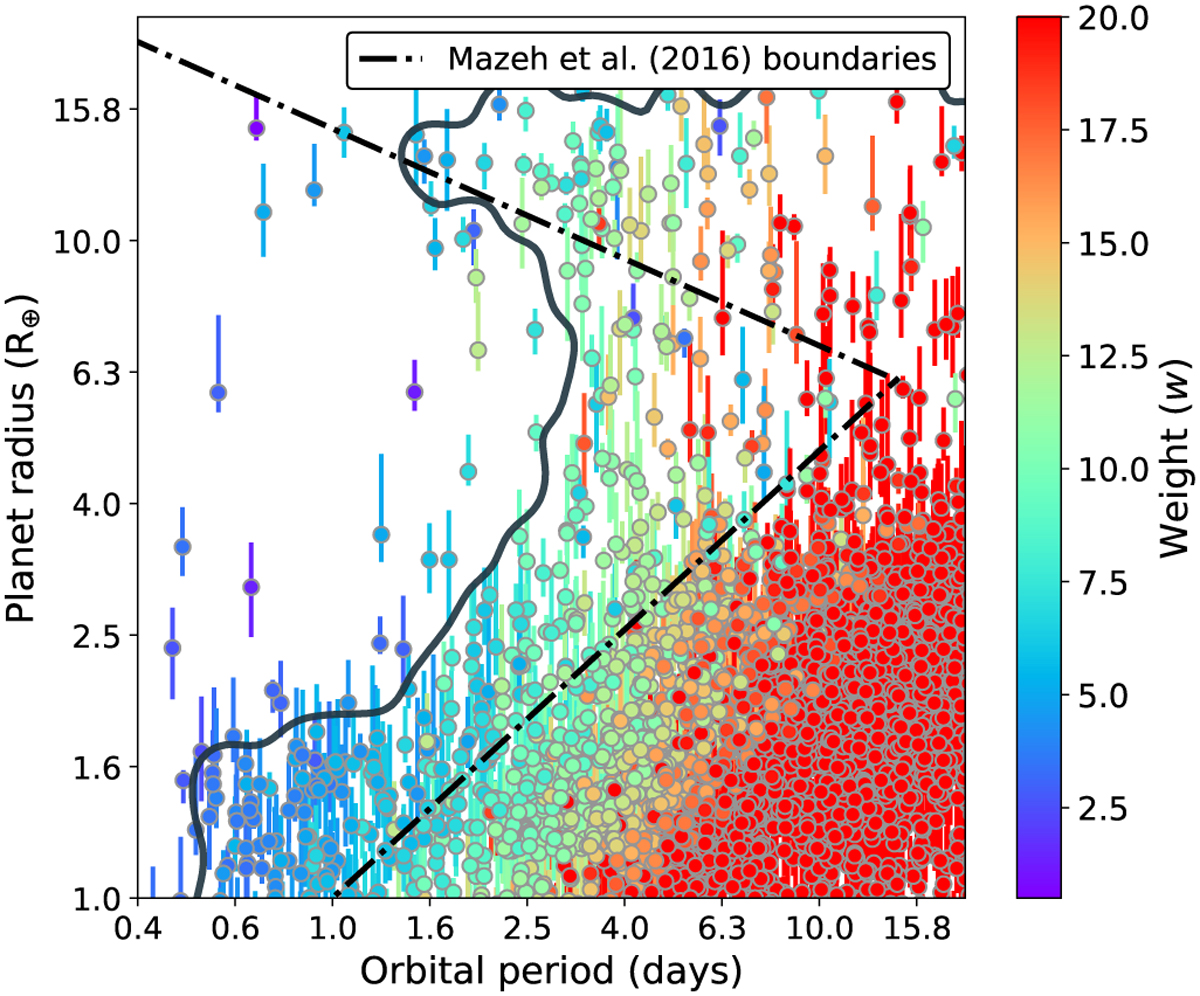
Planet radius versus orbital period of the Kepler DR25 catalogue. Each detection is coloured according to the assigned weight to correct for observational biases. The contour line represents the lowest percentile our dataset is sensitive to.
Current usage metrics show cumulative count of Article Views (full-text article views including HTML views, PDF and ePub downloads, according to the available data) and Abstracts Views on Vision4Press platform.
Data correspond to usage on the plateform after 2015. The current usage metrics is available 48-96 hours after online publication and is updated daily on week days.
Initial download of the metrics may take a while.