Fig. 5
Download original image
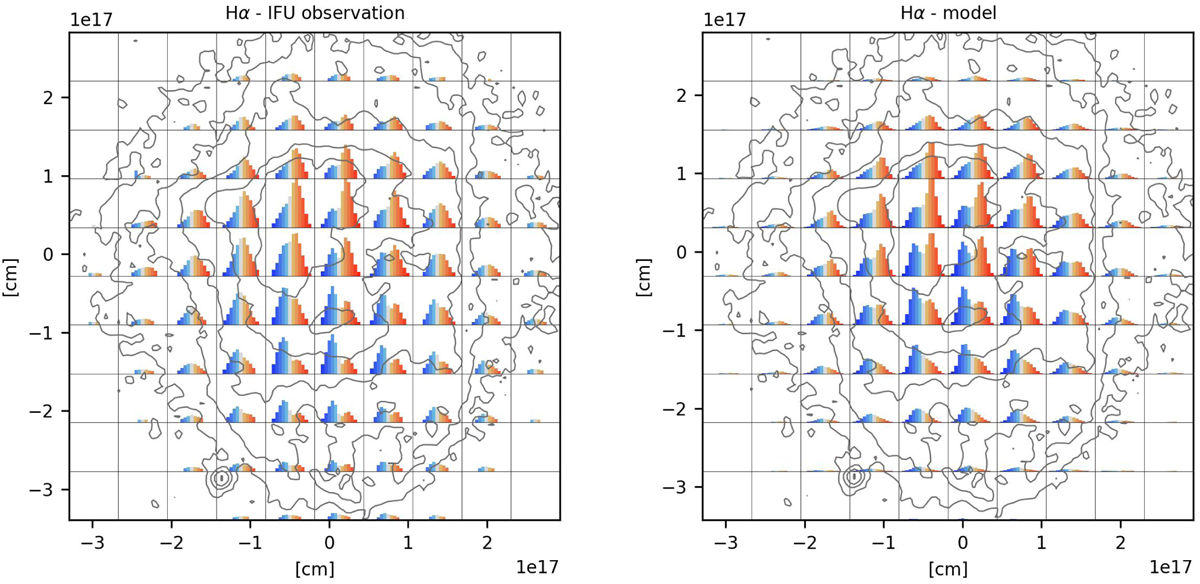
Detailed emission profiles of the Hα line shown for each of the IFU pixels. The left panel shows the observed data; the right panel shows the corresponding calculated model emissions. To emphasise the value and direction of the velocity, we applied colour coding where red means gas moving away from the observer and blue indicates gas moving towards the observer, and the higher the velocity, the more intense the colour. Grey is for zero. We plotted the emission in the form of bar plots. The width of each bar is 10 km s−1, and the height (intensity) has been normalised to the maximum value over the whole image. The horizontal size of each box extends to +75 km s−1; the vertical size is from zero to unity.
Current usage metrics show cumulative count of Article Views (full-text article views including HTML views, PDF and ePub downloads, according to the available data) and Abstracts Views on Vision4Press platform.
Data correspond to usage on the plateform after 2015. The current usage metrics is available 48-96 hours after online publication and is updated daily on week days.
Initial download of the metrics may take a while.