Fig. 4
Download original image
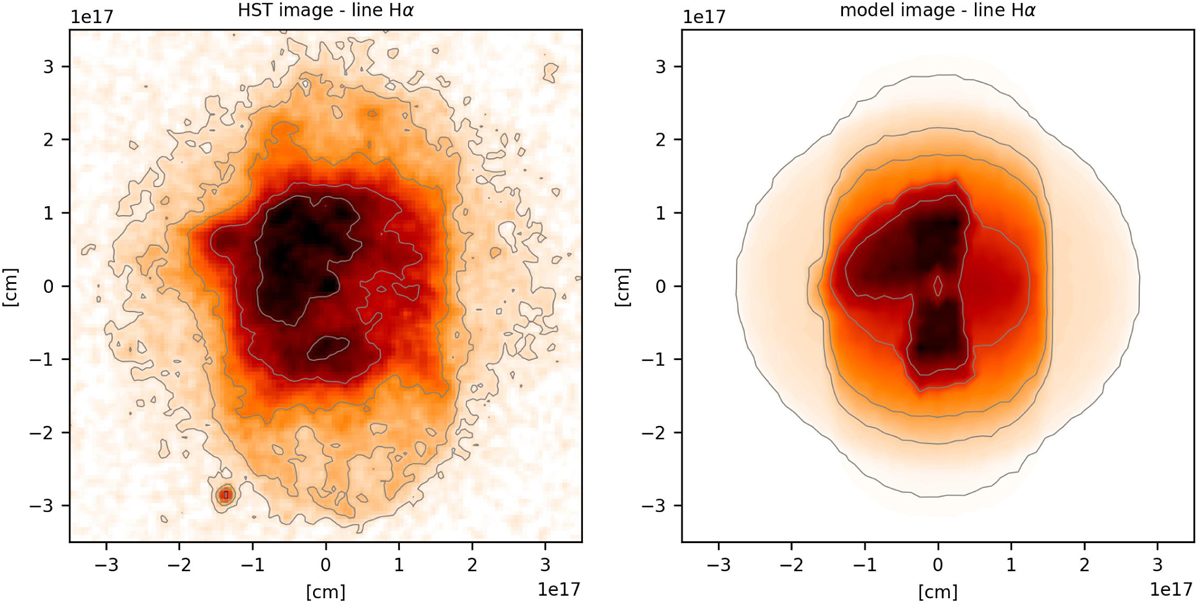
Observed image in the Hα line (left panel) compared with the one obtained from the assumed model (right panel). The axes are the same as in Fig. 1. The contours (0.04, 0.09, 0.19, 0.4, 0.6 of maximum) were selected to bring out the substructures; the same contours are shown in both panels and in all other plots. For the model image, the main nebular axis is inclined to the sky plane at 40 deg, and because of a lack of background noise, the lowest contour is set at the 0.01 level.
Current usage metrics show cumulative count of Article Views (full-text article views including HTML views, PDF and ePub downloads, according to the available data) and Abstracts Views on Vision4Press platform.
Data correspond to usage on the plateform after 2015. The current usage metrics is available 48-96 hours after online publication and is updated daily on week days.
Initial download of the metrics may take a while.