Fig. 3
Download original image
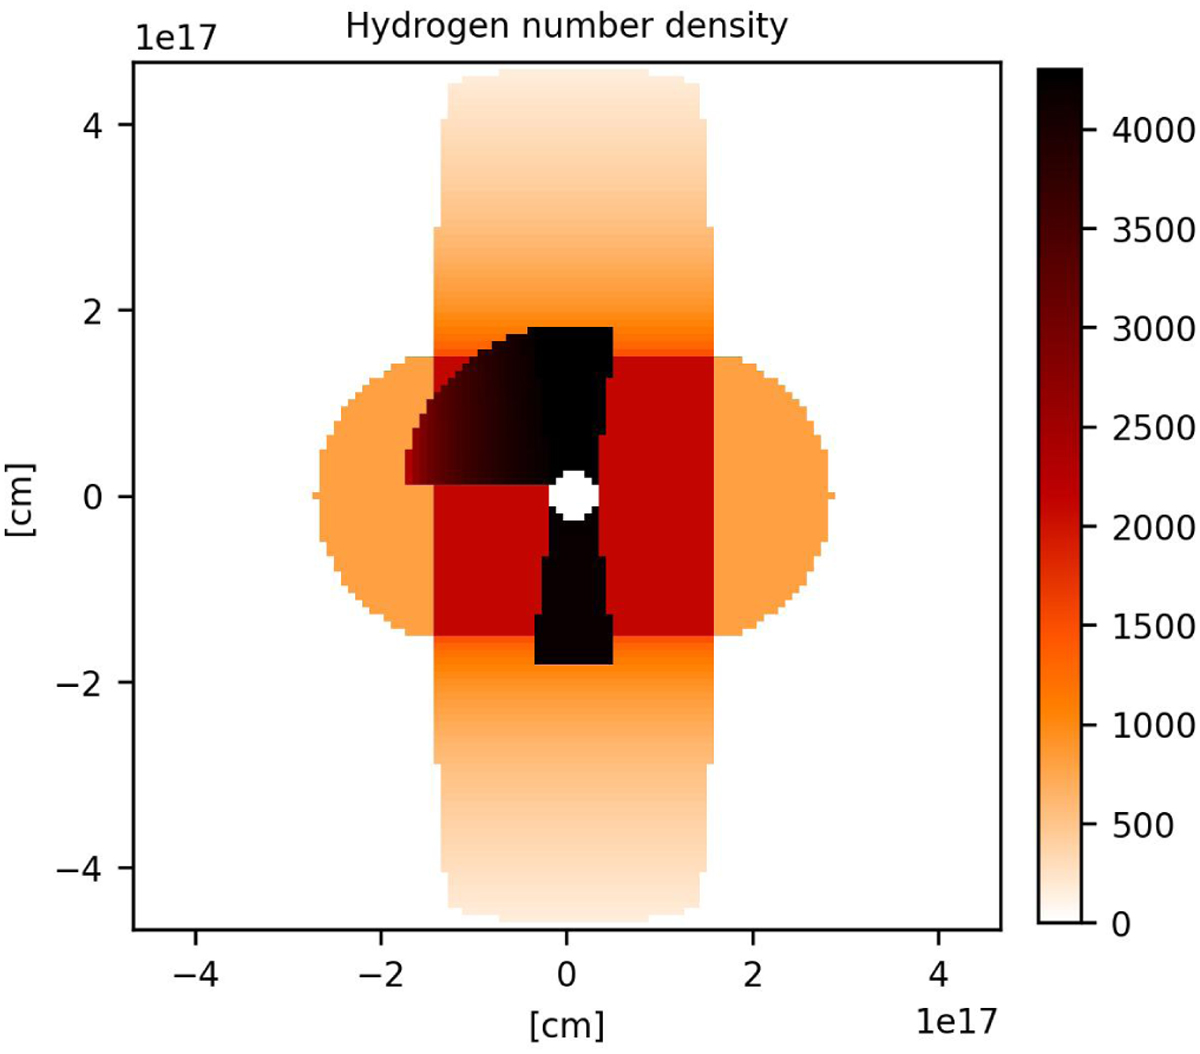
Density cross-section of the assumed model. The symmetry axis is positioned vertically; all structures (except for the plume) are cylin-drically symmetrical. This graph shows the true spatial dimensions of the substructures for a distance of 8 kpc. The plume is in the plane of the image and extends to ±2.4 × 1016 cm above and below it.
Current usage metrics show cumulative count of Article Views (full-text article views including HTML views, PDF and ePub downloads, according to the available data) and Abstracts Views on Vision4Press platform.
Data correspond to usage on the plateform after 2015. The current usage metrics is available 48-96 hours after online publication and is updated daily on week days.
Initial download of the metrics may take a while.