Fig. 8
Download original image
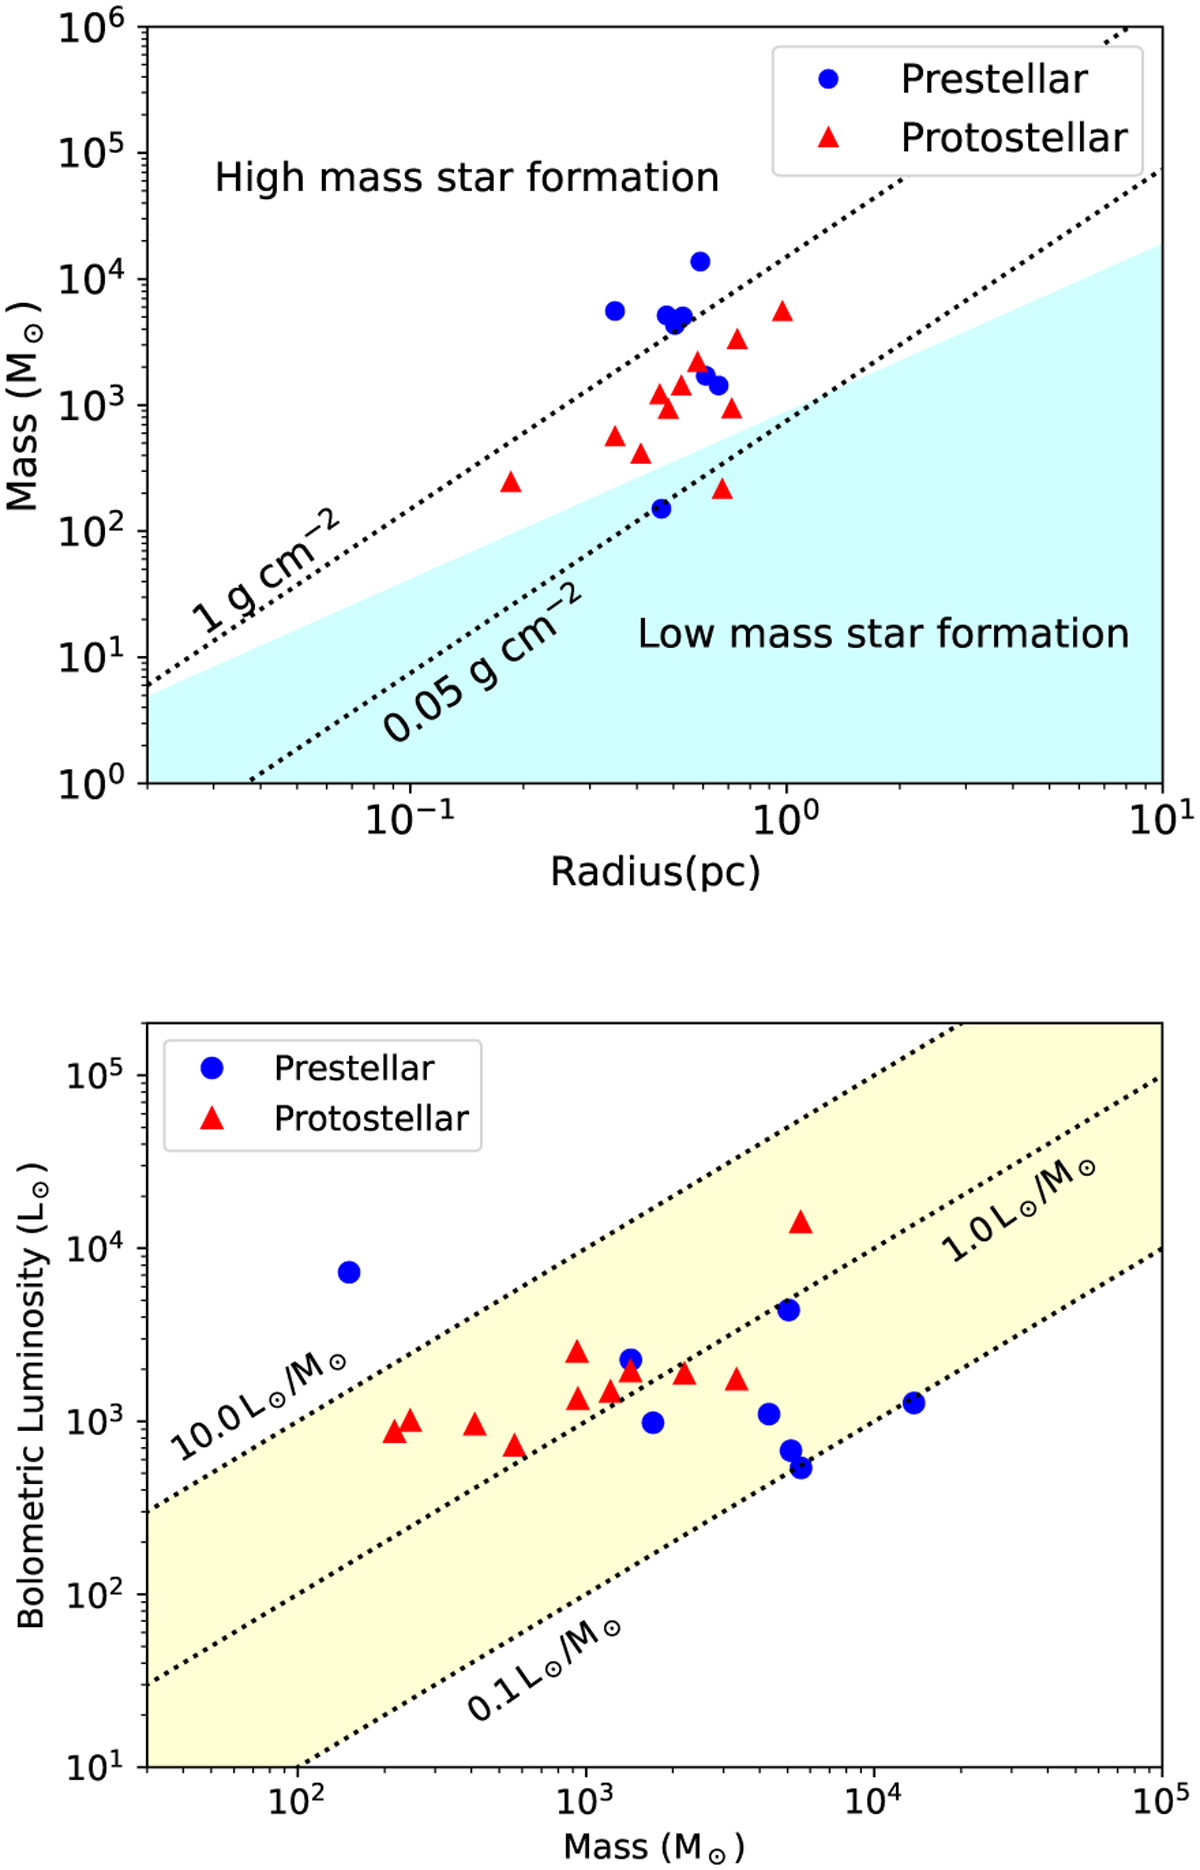
(Top) Mass–radius relation of 19 Hi-GAL clumps. The shaded area represents range of masses consistent with low mass star formation, satisfying the criteria M ≤ 870 M⊙ (r/pc)1.33 (Kauffmann & Pillai 2010). The dotted lines indicate surface density thresholds of 1.0 g cm−2, and 0.05 g cm−2, respectively. (Bottom) Bolometric luminosity-mass relation of 19 Hi-GAL clumps. Dotted lines represent (L/M) = 0.1, 1.0, and 10.0 L⊙/M⊙, respectively.
Current usage metrics show cumulative count of Article Views (full-text article views including HTML views, PDF and ePub downloads, according to the available data) and Abstracts Views on Vision4Press platform.
Data correspond to usage on the plateform after 2015. The current usage metrics is available 48-96 hours after online publication and is updated daily on week days.
Initial download of the metrics may take a while.