Fig. 7
Download original image
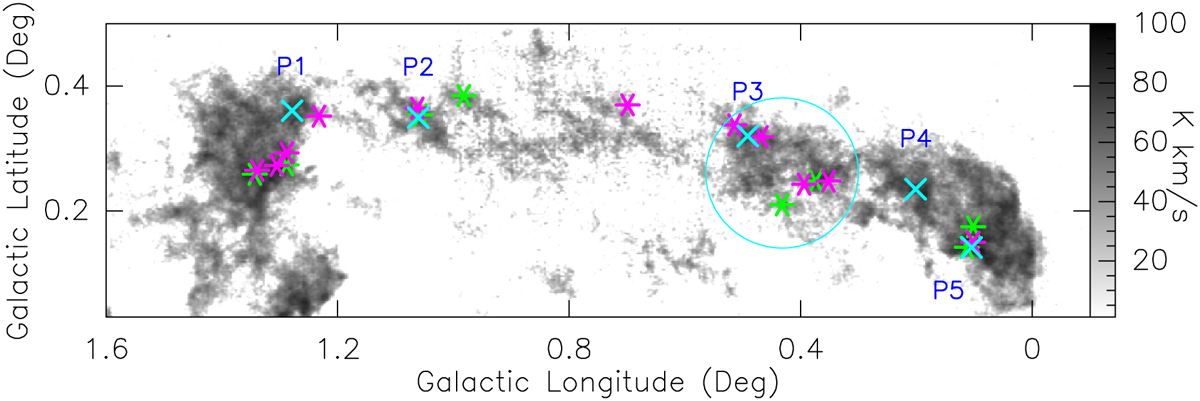
13CO integrated intensity map overlaid with Hi-GAL prestellar (green asterisks) and protostellar (magenta asterisks) clumps. Red triangle corresponds to the location of the radio source GPSR5 0.431+0.262. Blue circle roughly corresponds to the location of ring-like feature observed in the PV diagram. The five positions used for SiO observations are marked as ×.
Current usage metrics show cumulative count of Article Views (full-text article views including HTML views, PDF and ePub downloads, according to the available data) and Abstracts Views on Vision4Press platform.
Data correspond to usage on the plateform after 2015. The current usage metrics is available 48-96 hours after online publication and is updated daily on week days.
Initial download of the metrics may take a while.