Fig. 6
Download original image
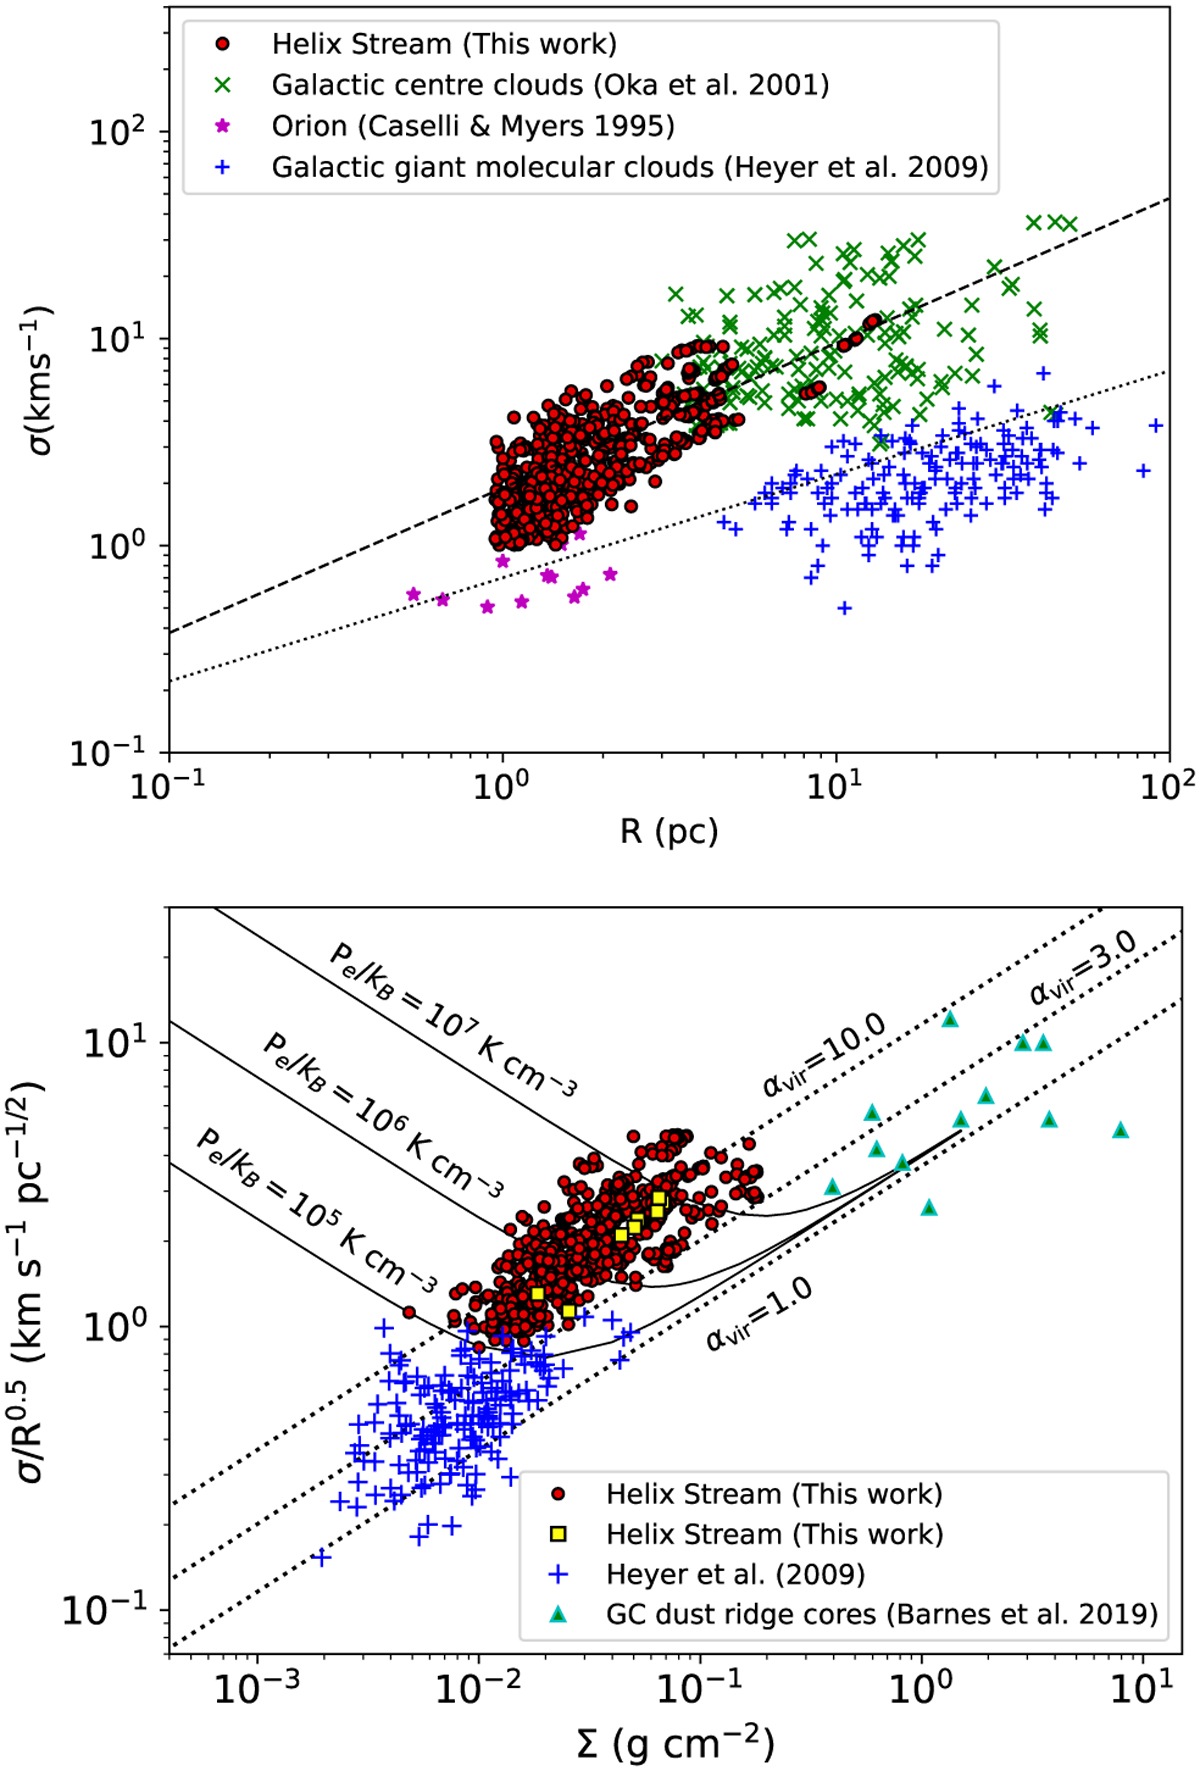
(Top) Comparison of size versus velocity dispersion in the helix stream (red dots) with values of Galactic centre clouds from Oka et al. (2001b, green ×), the Orion A and B giant molecular clouds (magenta stars; Caselli & Myers 1995) and other Galactic giant molecular clouds (blue crosses; Heyer et al. 2009). The dotted line corresponds to the best-fit result from Solomon et al. (1987), σ = 0.7 R0.5. The dashed line corresponds to the best-fit result for the helix stream σ = 2.97 R0.70. (Bottom) Heyer’s relation (surface density, ∑, versus σ/R0.5) for different Galactic clouds. Dots correspond to the structures within the helix stream, squares correspond to structures within the helix stream where follow-up molecular observations are carried out, crosses represent Galactic giant molecular clouds (Heyer et al. 2009), and triangles represent high-density cores in the GC ‘dust-ridge’ clouds (Barnes et al. 2019). Black curves indicate solutions of pressure-bounded virial equilibrium and dotted lines correspond to αvir=1.0, 3.0, and 10.0, where there is negligible external pressure.
Current usage metrics show cumulative count of Article Views (full-text article views including HTML views, PDF and ePub downloads, according to the available data) and Abstracts Views on Vision4Press platform.
Data correspond to usage on the plateform after 2015. The current usage metrics is available 48-96 hours after online publication and is updated daily on week days.
Initial download of the metrics may take a while.