Fig. 4
Download original image
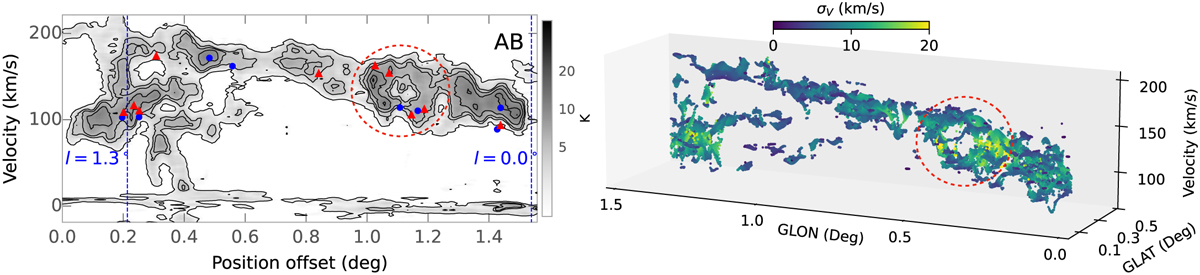
Kinematics of the helix stream. (Left) 12CO(1–0) PV diagram of the helix stream along the cut AB indicated in Fig. 3 overlaid with the position-velocity loci of Hi-GAL prestellar (blue dots) and protostellar (red triangles) clumps discussed in Section 3.4. (Right) The 13CO (2–1) PPV plot of the helix stream generated from spectral decomposition using GAUSSPY+. Each velocity component is colour coded according to its velocity dispersion. Ellipse marks the shell feature discussed in Section 4.1.
Current usage metrics show cumulative count of Article Views (full-text article views including HTML views, PDF and ePub downloads, according to the available data) and Abstracts Views on Vision4Press platform.
Data correspond to usage on the plateform after 2015. The current usage metrics is available 48-96 hours after online publication and is updated daily on week days.
Initial download of the metrics may take a while.