Open Access
Fig. 3
Download original image
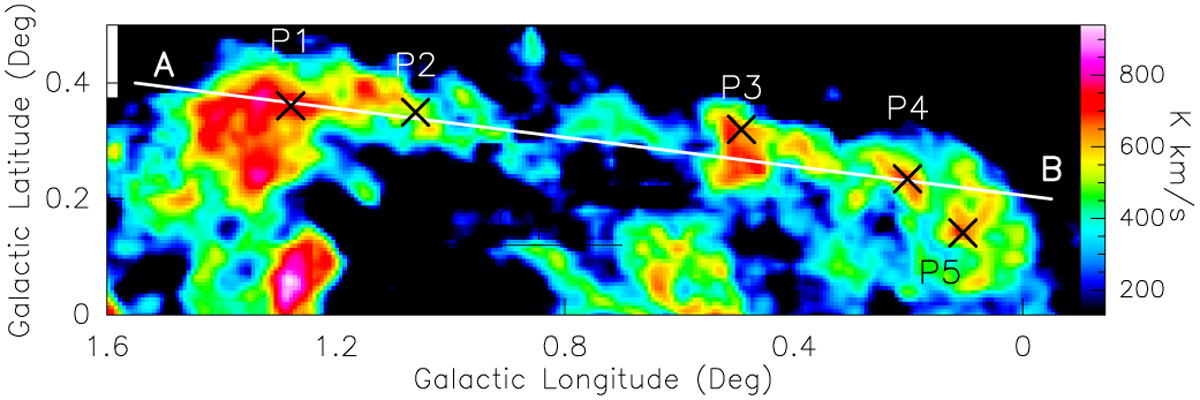
12CO(1–0) integrated intensity map (Oka et al. 1998) of the helix stream (shown in Figs. 1 (right) and 2) in the velocity range 100–200 km s−1. The white straight line AB used to construct the PV diagram is marked. The five positions used for SiO observations are marked as × and are labelled.
Current usage metrics show cumulative count of Article Views (full-text article views including HTML views, PDF and ePub downloads, according to the available data) and Abstracts Views on Vision4Press platform.
Data correspond to usage on the plateform after 2015. The current usage metrics is available 48-96 hours after online publication and is updated daily on week days.
Initial download of the metrics may take a while.