Fig. 12
Download original image
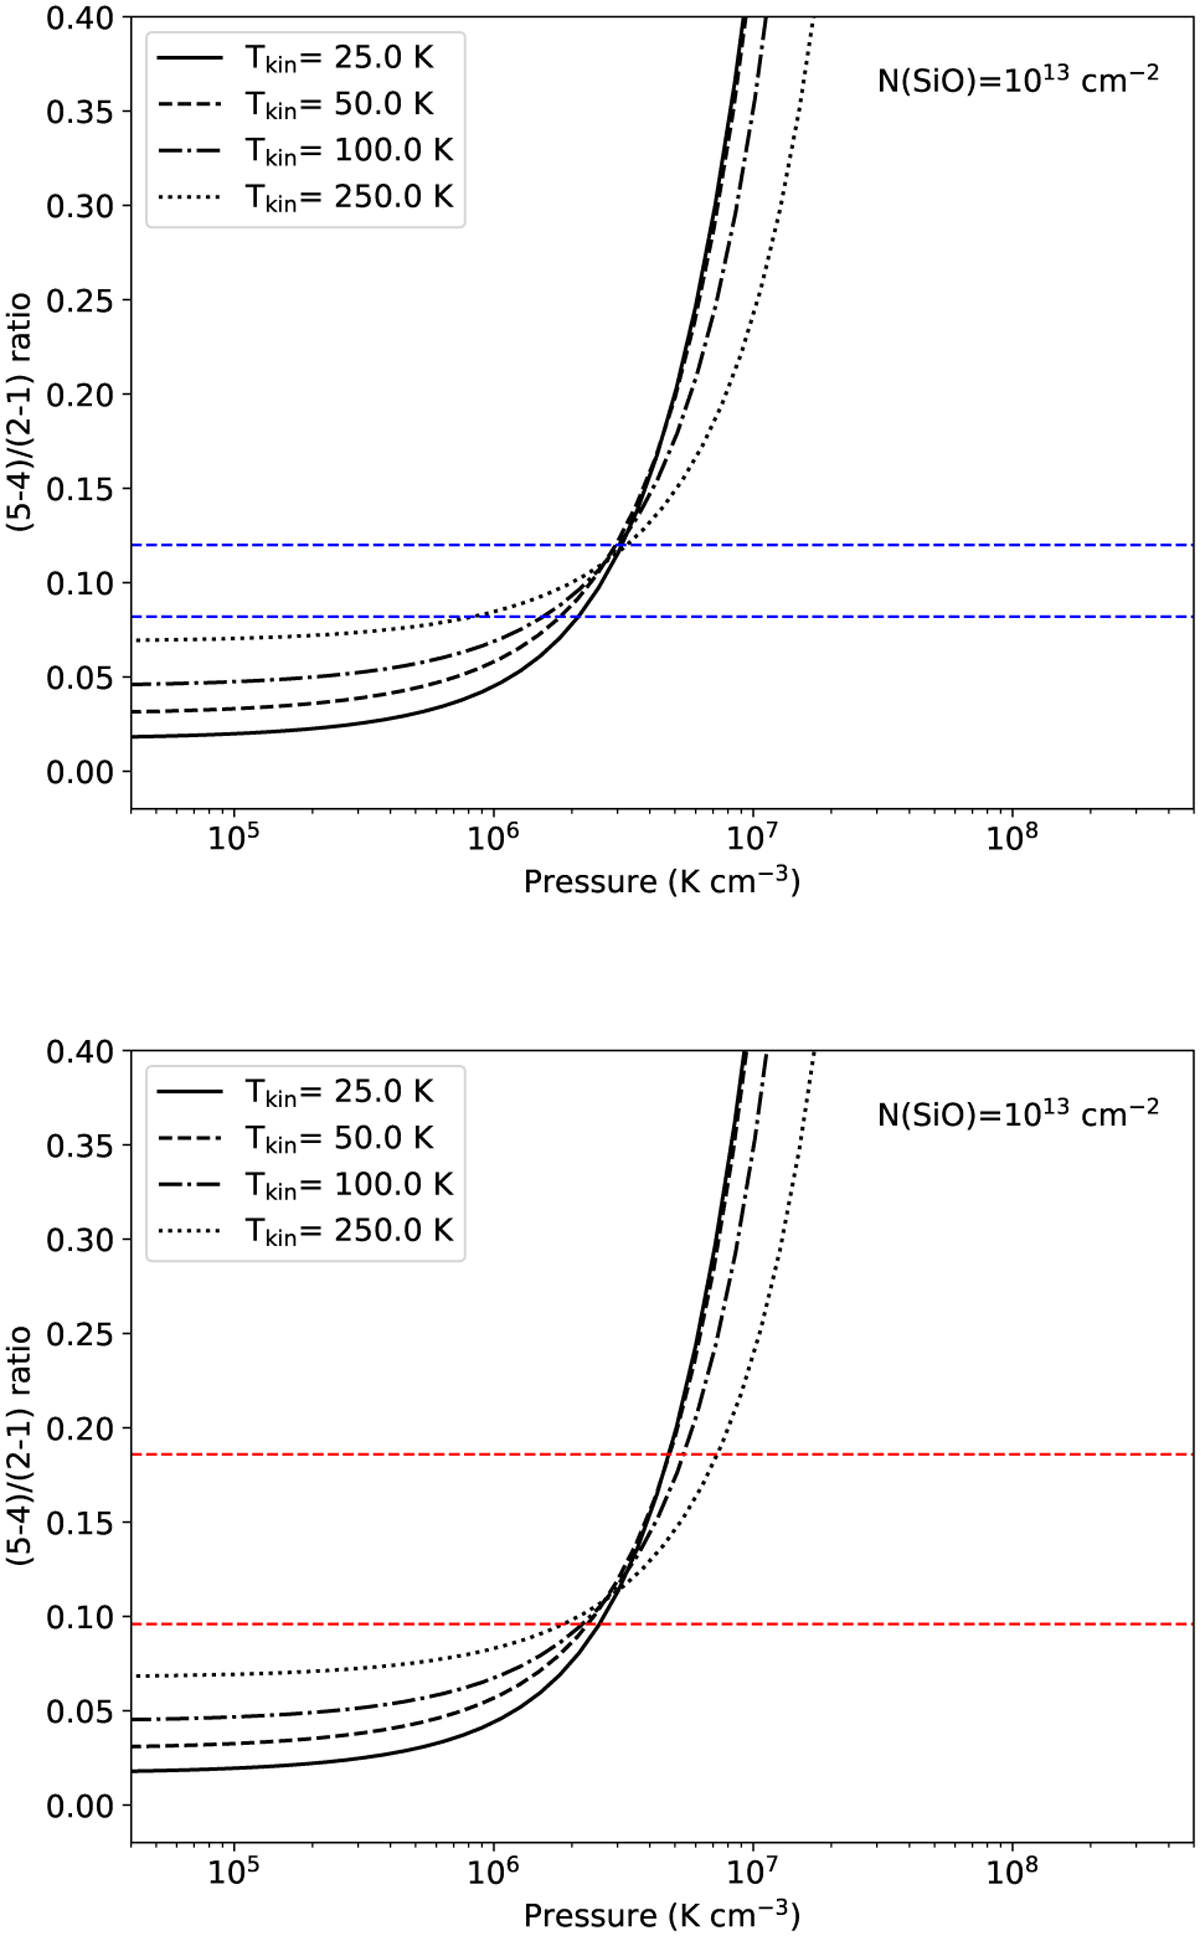
RADEX predictions for the SiO (5–4)/(2–l) integrated intensity ratio plotted as a function of the thermal pressure, n(H2)T, for two different line widths 13 km s−1 (top) and 30 km s−1 (bottom). The calculations were carried out for SiO column density of 1013 cm−2 and kinetic temperatures of 25, 50, 100 and 250 K. The observed range of line ratios for the narrow components (represented by blue dashed lines) and broad components (represented by red dashed lines) are also plotted.
Current usage metrics show cumulative count of Article Views (full-text article views including HTML views, PDF and ePub downloads, according to the available data) and Abstracts Views on Vision4Press platform.
Data correspond to usage on the plateform after 2015. The current usage metrics is available 48-96 hours after online publication and is updated daily on week days.
Initial download of the metrics may take a while.