Fig. 11
Download original image
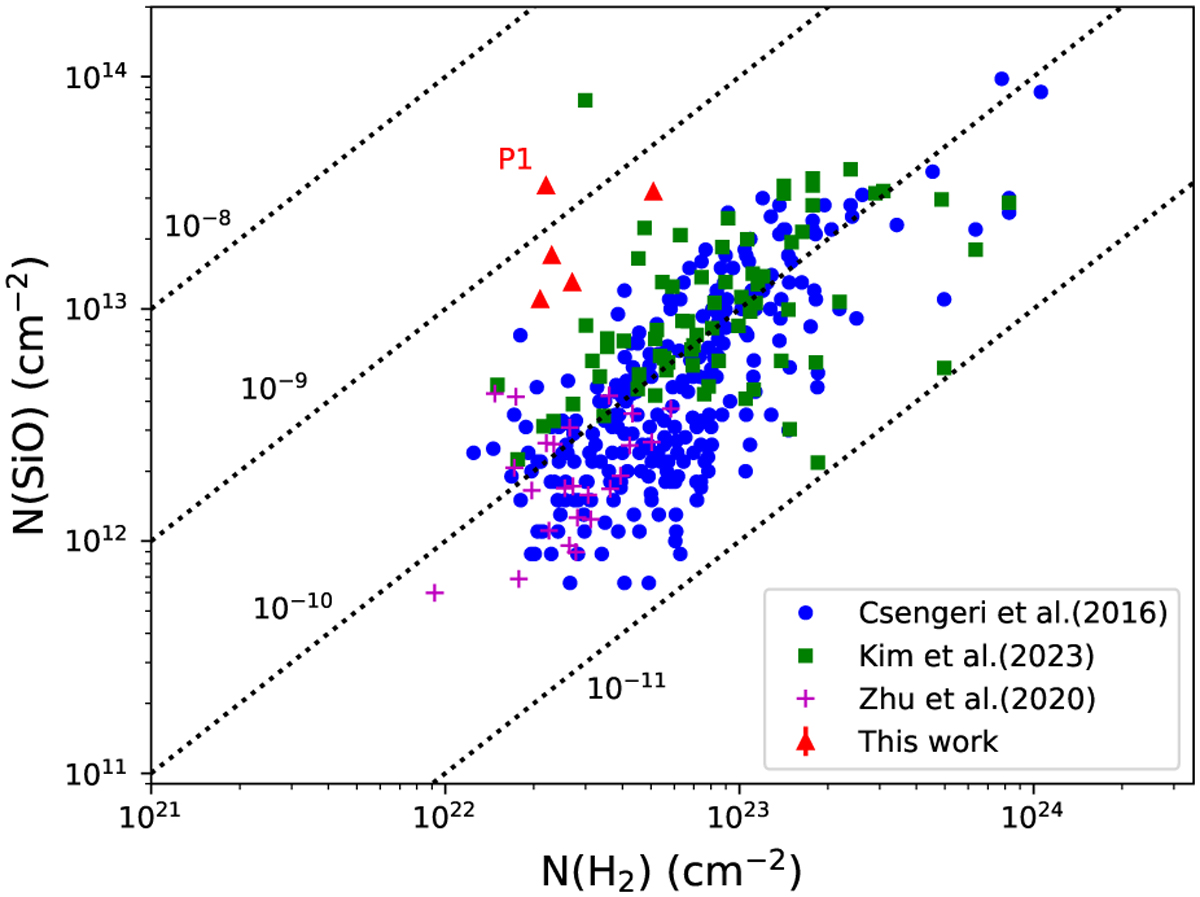
SiO column density, N(SiO), as a function of molecular hydrogen column density, N(H2). Dotted lines correspond to SiO abundances, X(SiO), with respect to N(H2). Red triangles correspond to helix stream, blue dots represent data from Csengeri et al. (2016), magenta crosses from Zhu et al. (2020) and green squares correspond to data from Kim et al. (2023).
Current usage metrics show cumulative count of Article Views (full-text article views including HTML views, PDF and ePub downloads, according to the available data) and Abstracts Views on Vision4Press platform.
Data correspond to usage on the plateform after 2015. The current usage metrics is available 48-96 hours after online publication and is updated daily on week days.
Initial download of the metrics may take a while.