Open Access
Fig. 4
Download original image
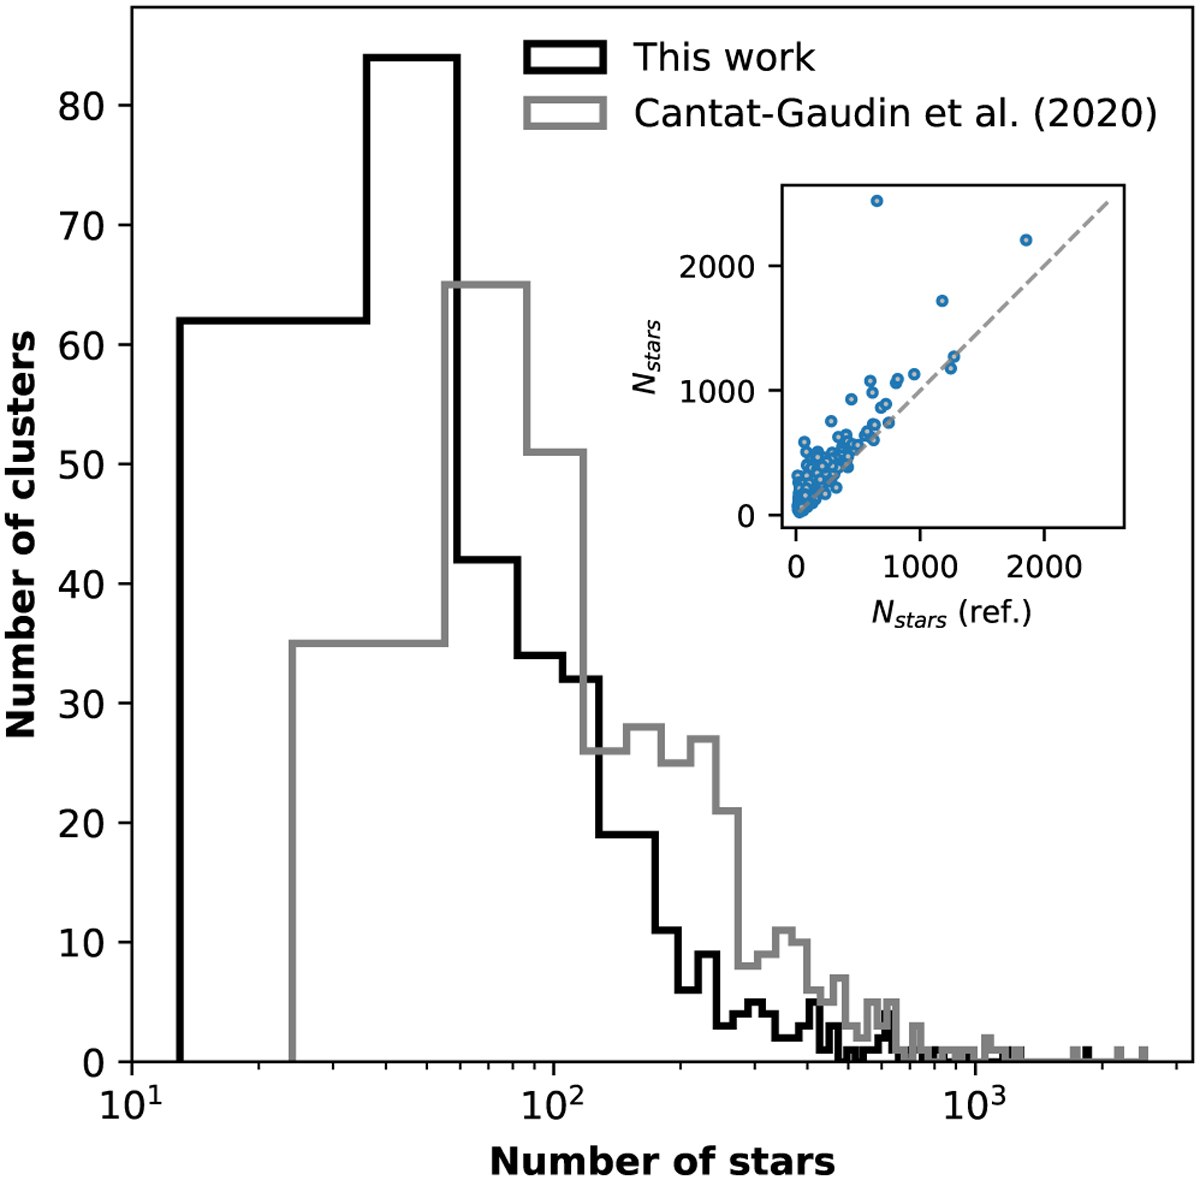
Histogram of the number of stars (Nstars) found in this work and those reported in Cantat-Gaudin et al. (2020). The inset shows a plot of the comparison in number of stars between this work (y-axis) and Cantat-Gaudin et al. (2020) (x-axis). The dashed line in the inset represents the identity.
Current usage metrics show cumulative count of Article Views (full-text article views including HTML views, PDF and ePub downloads, according to the available data) and Abstracts Views on Vision4Press platform.
Data correspond to usage on the plateform after 2015. The current usage metrics is available 48-96 hours after online publication and is updated daily on week days.
Initial download of the metrics may take a while.