Fig. 3
Download original image
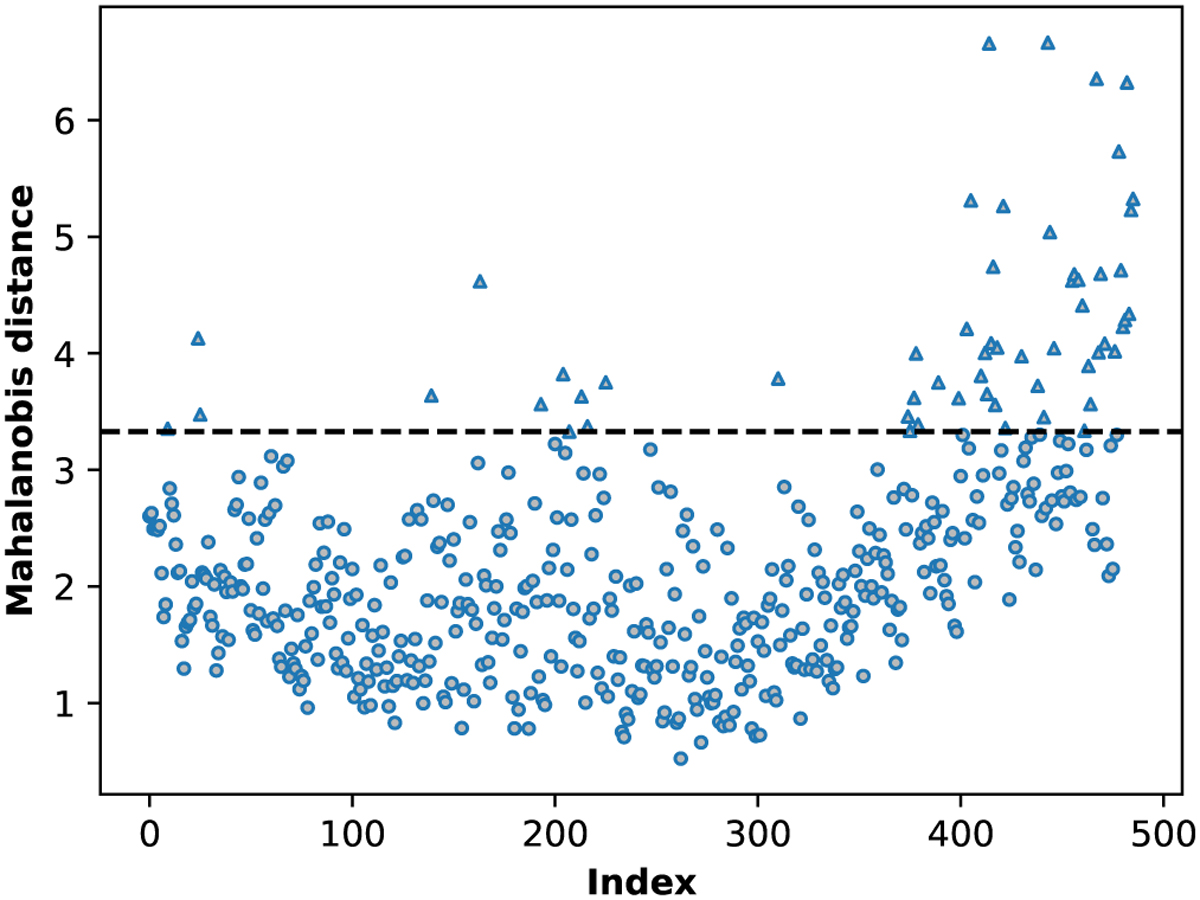
Mahalanobis distance distribution for the Roslund 6 members selected by the HDBSCAN algorithm. The horizontal dashed black line is the outlier threshold with a value of c = 3.33. There are 57 stars identified as outliers in this open cluster, indicated by triangles above the dashed line. The horizontal axis represents an arbitrary star index assigned by HDBSCAN to the selected members.
Current usage metrics show cumulative count of Article Views (full-text article views including HTML views, PDF and ePub downloads, according to the available data) and Abstracts Views on Vision4Press platform.
Data correspond to usage on the plateform after 2015. The current usage metrics is available 48-96 hours after online publication and is updated daily on week days.
Initial download of the metrics may take a while.