Fig. 6
Download original image
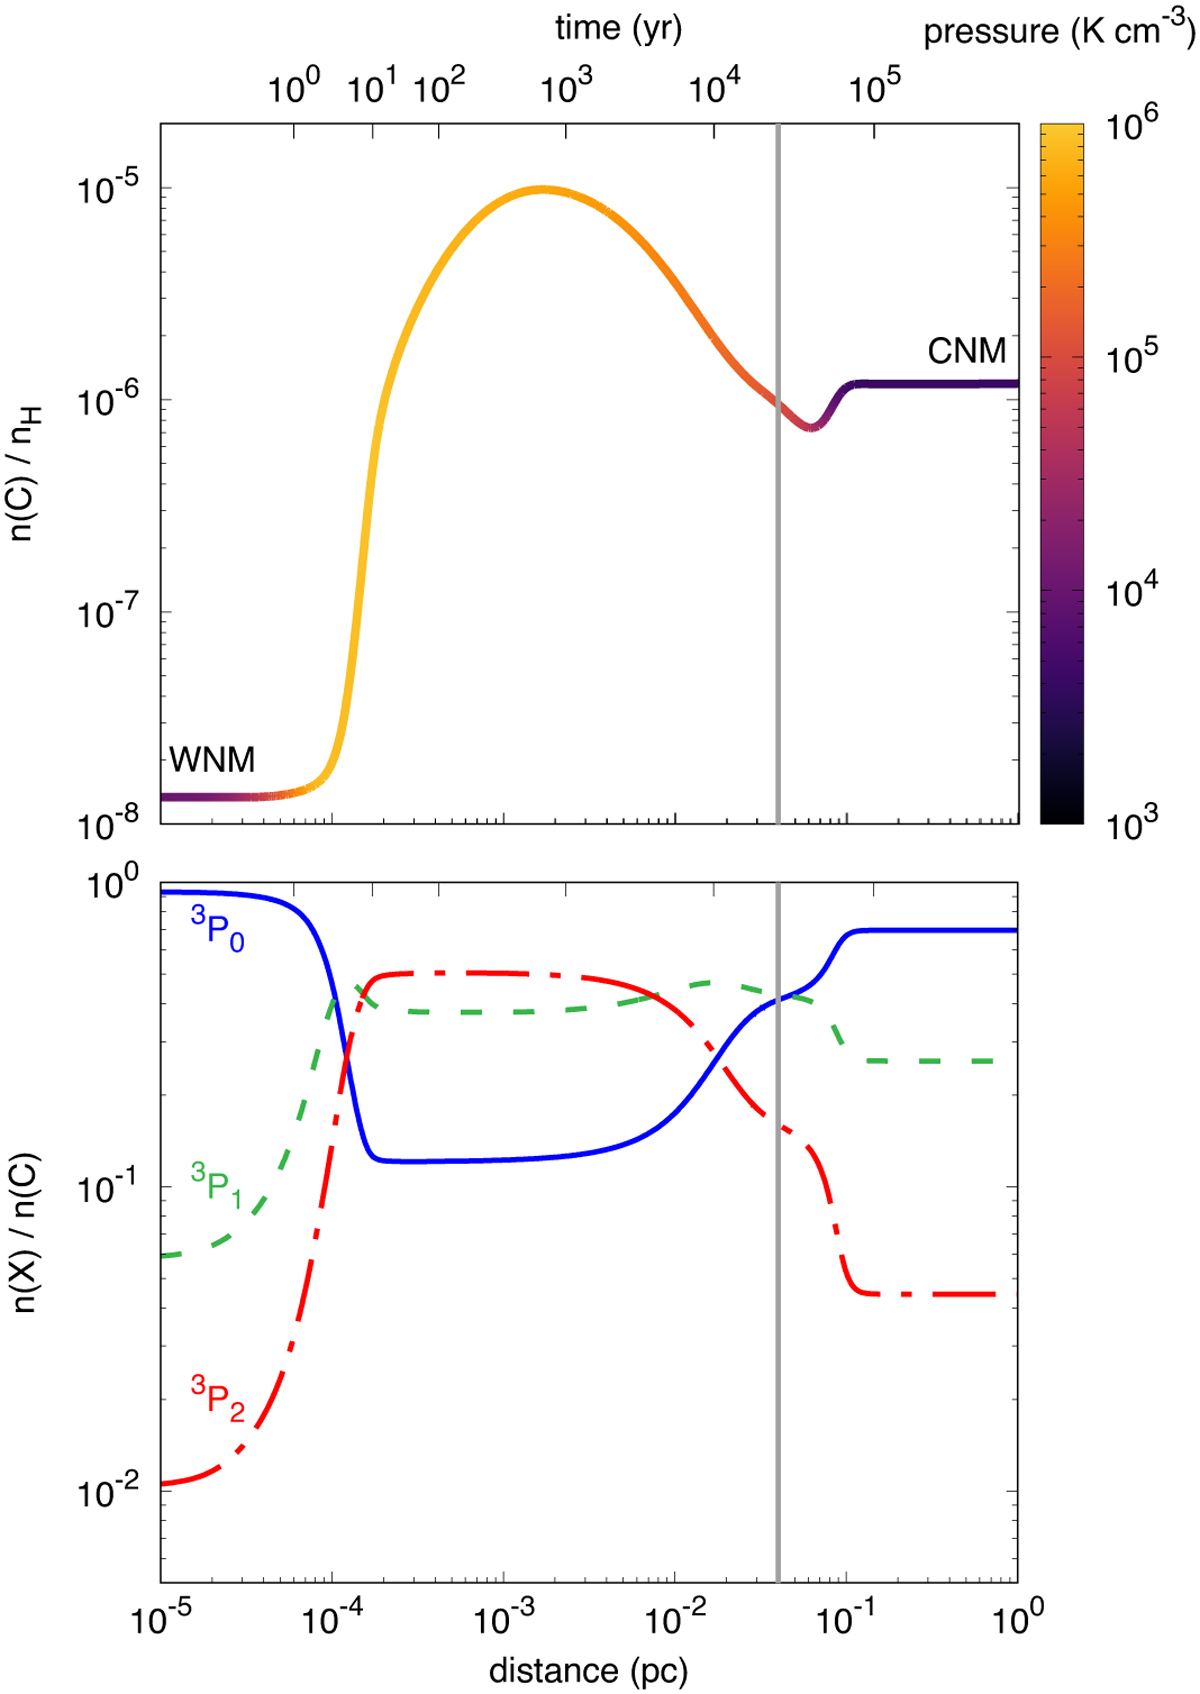
Chemical and excitation profiles of neutral carbon across the standard model. Top panel: relative abundance of neutral carbon as a function of the distance (bottom axis) or time (top axis) in the shock. The curve is colour-coded according to the value of the thermal pressure along the trajectory. Bottom panel: populations of the three fine structure levels of C as a function of the distance (bottom axis) or time (top axis) in the shock. The vertical grey line in both panels indicates the distance and time at which the gas reaches a fraction, χ = 0.95, of the final density, ![]() .
.
Current usage metrics show cumulative count of Article Views (full-text article views including HTML views, PDF and ePub downloads, according to the available data) and Abstracts Views on Vision4Press platform.
Data correspond to usage on the plateform after 2015. The current usage metrics is available 48-96 hours after online publication and is updated daily on week days.
Initial download of the metrics may take a while.