Fig. 5
Download original image
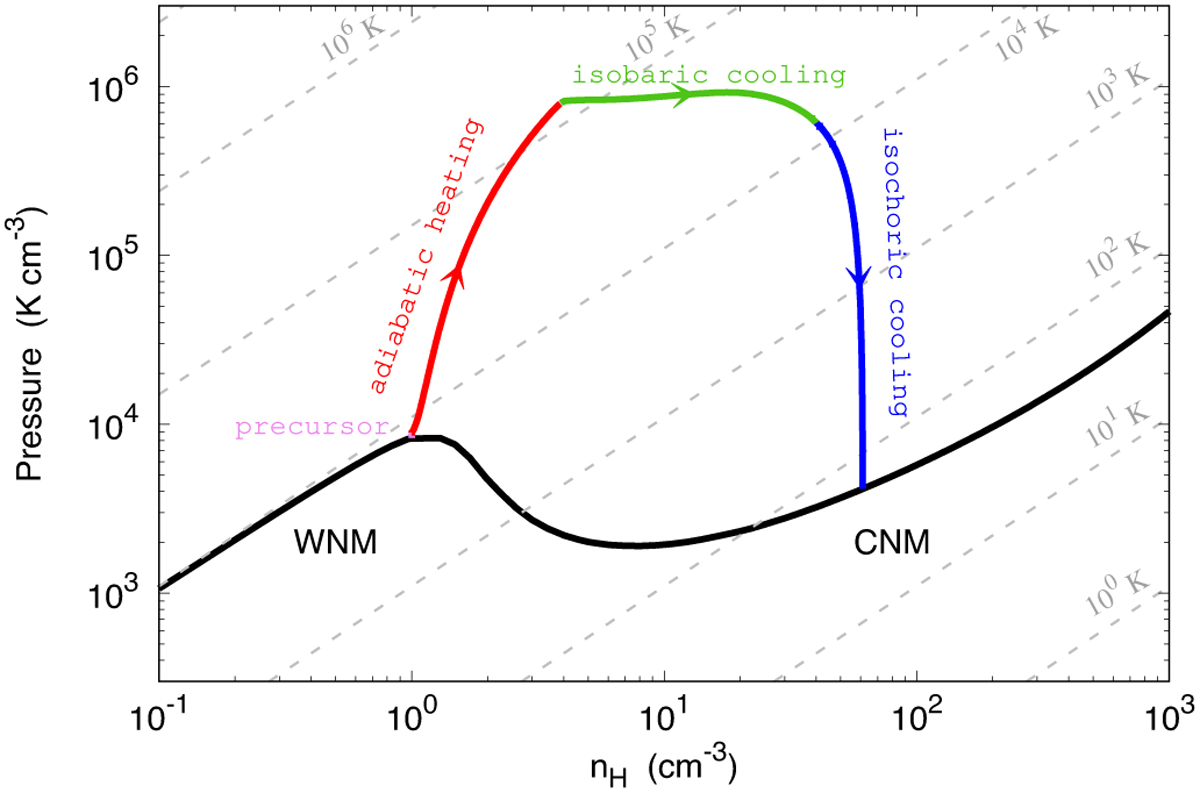
Trajectory of a shocked fluid particle from the ambient medium to the post-shock region obtained in the standard model. The trajectory is displayed in a proton density–thermal pressure diagram to highlight the phase transition from the WNM to the CNM induced by a shock at 80 km s−1. A fluid particle initially evolves through the radiative precursor (pink). As it crosses a shock front, it undergoes three successive regimes: an adiabatic heating (red curve) followed by a quasi-isobaric cooling (green curve), and, finally, a quasi-isochoric cooling (blue curve) as the magnetic pressure becomes dominant in the post-shock gas. The black curve indicates the thermal equilibrium state of the diffuse gas obtained for G0 = 1 (see Fig. 1 of Paper I). Light grey lines are isothermal contours from 1 to 106 K (from bottom right to top left). Note that these isocontours are not evenly spaced due to the change in the number of particles in a gas at high temperature (see Fig. 5 of Paper I).
Current usage metrics show cumulative count of Article Views (full-text article views including HTML views, PDF and ePub downloads, according to the available data) and Abstracts Views on Vision4Press platform.
Data correspond to usage on the plateform after 2015. The current usage metrics is available 48-96 hours after online publication and is updated daily on week days.
Initial download of the metrics may take a while.