Fig. 4
Download original image
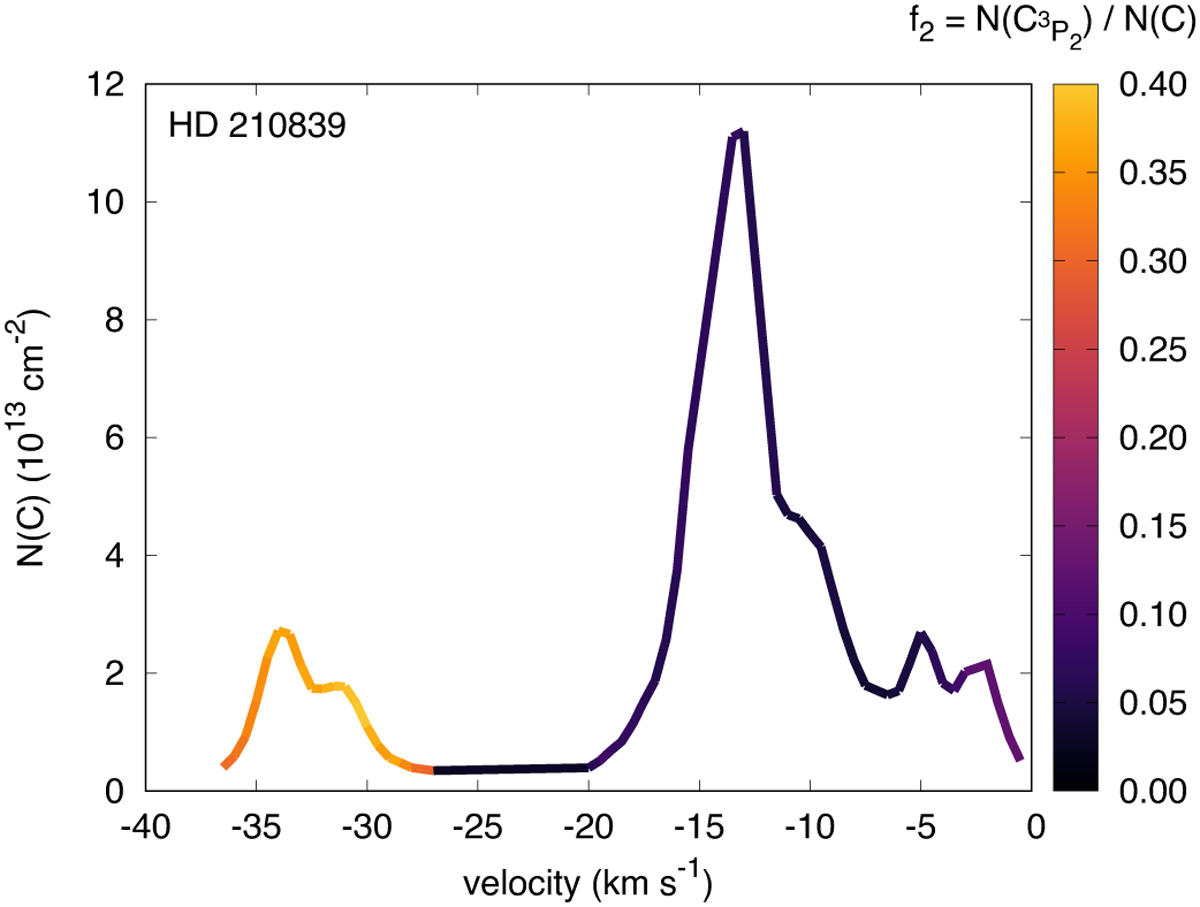
Column density spectrum of neutral carbon observed towards HD 210839 (from Table 4 of JT11). The column densities are derived over velocity intervals of 0.5 km s−1. Each point along the spectrum is colour-coded according to the value of the f2 column density ratio to highlight velocity components at different thermal pressures.
Current usage metrics show cumulative count of Article Views (full-text article views including HTML views, PDF and ePub downloads, according to the available data) and Abstracts Views on Vision4Press platform.
Data correspond to usage on the plateform after 2015. The current usage metrics is available 48-96 hours after online publication and is updated daily on week days.
Initial download of the metrics may take a while.