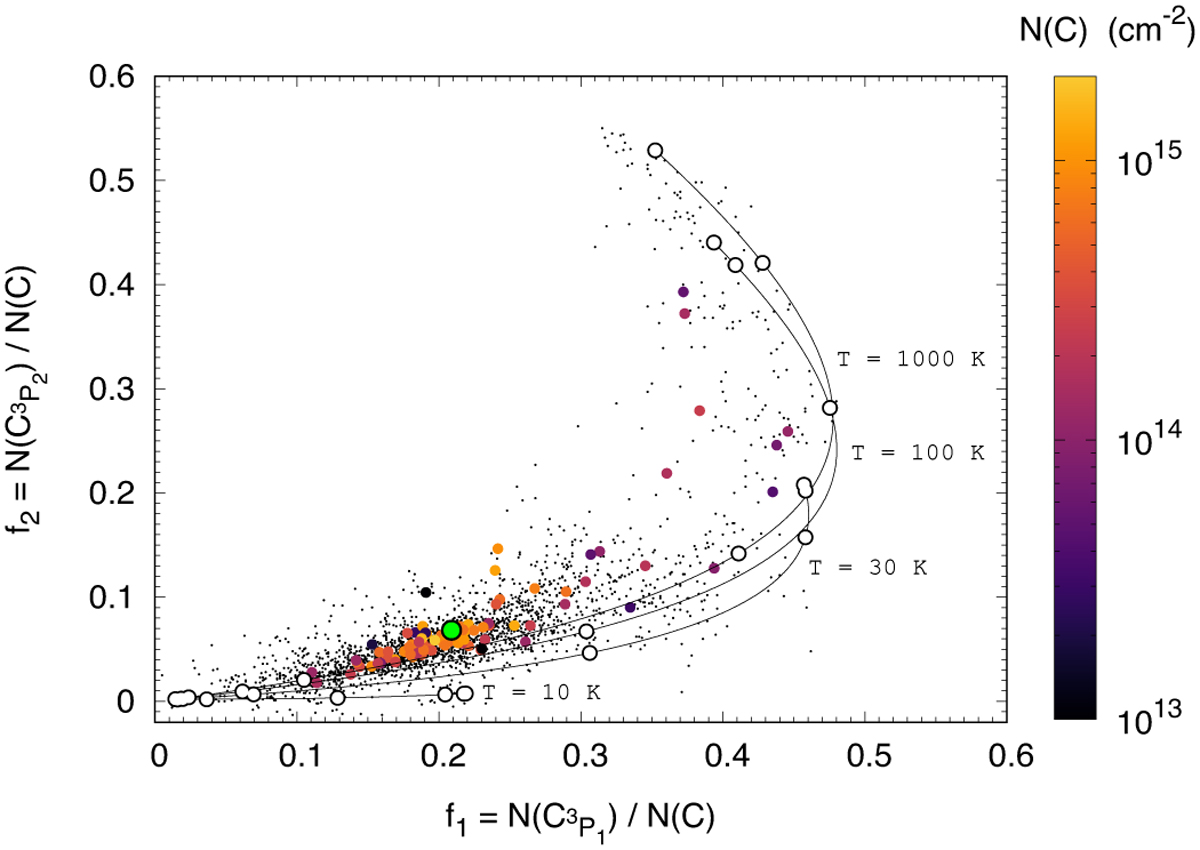
Fig. 2
Download original image
Excitation properties of the neutral carbon along the lines of sight observed by JT11. The filled coloured circles indicate the f1 and f2 column density ratios observed along each line of sight. Each circle is colour-coded according to the total column density of neutral carbon, N(C). The black dots show the f1 and f2 column density ratios obtained per velocity interval of 0.5 km s−1. The filled green circle shows the total f1 and f2 ratios computed over the entire observational sample. The black curves display the theoretical ratios obtained for homogeneous gas with kinetic temperatures of 10, 30, 100, and 1000 K and thermal pressures varying, along each curve, between 102 and 107 K cm−3 (from the bottom left to the top right). The empty white circles indicate integer values of the logarithm of the thermal pressure (see Fig. 3).
Current usage metrics show cumulative count of Article Views (full-text article views including HTML views, PDF and ePub downloads, according to the available data) and Abstracts Views on Vision4Press platform.
Data correspond to usage on the plateform after 2015. The current usage metrics is available 48-96 hours after online publication and is updated daily on week days.
Initial download of the metrics may take a while.