Fig. 14
Download original image
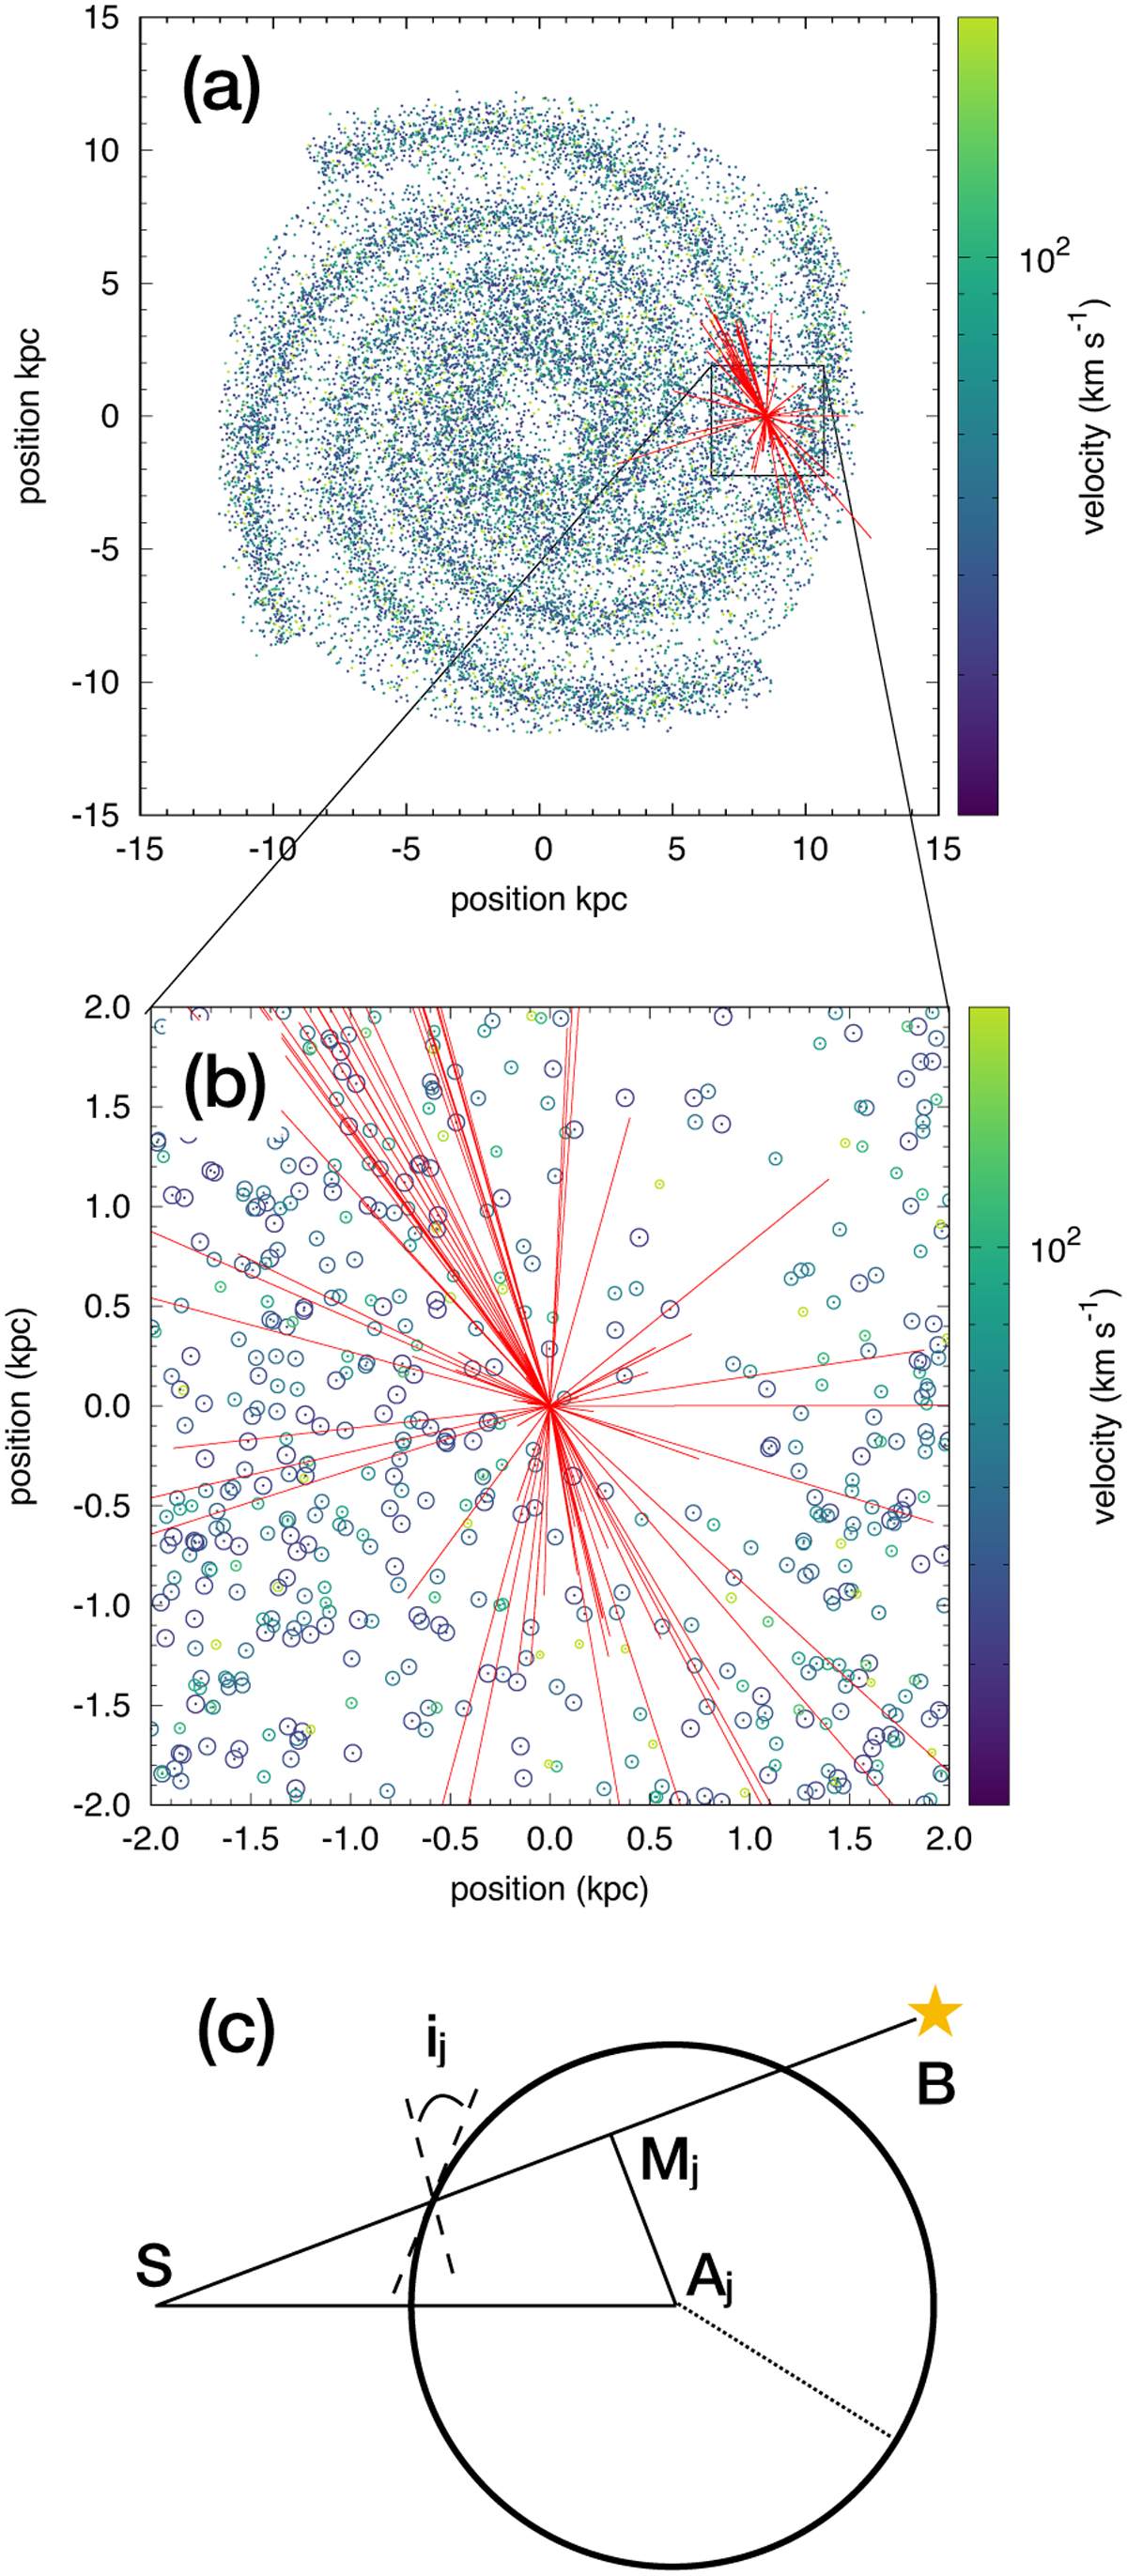
Schematic view of the calculation of the dissipation rates expected from SNRs along the lines of sight observed by JT11. A distribution of SNRs with terminal velocities between 30 and 200 km s−1 is drawn out of a simple description of supernovae explosions within the disc and the spiral arms of the Galaxy (panel a). The SNRs are colour-coded according to their terminal velocities. The lines of sight observed by JT11 (red lines) are analysed to count the number of SNR surfaces they intercept and compute the dissipation rates induced by the associated shocks (panels b and c). This calculation is done taking into account the 3D spatial distribution of SNRs, which is shown in projection in panels a and b. Panel c displays a schematic view of a single SNR located at a position Aj. An observed line of sight connects the position of the sun, S, to the position of the background star, B. The number of surfaces crossed by the line of sight for this single SNR (0, 1, or 2) and their inclination angle, ij, depend on the position of the point, Mj, along the SB line and its distance to Aj compared to the SNR radius.
Current usage metrics show cumulative count of Article Views (full-text article views including HTML views, PDF and ePub downloads, according to the available data) and Abstracts Views on Vision4Press platform.
Data correspond to usage on the plateform after 2015. The current usage metrics is available 48-96 hours after online publication and is updated daily on week days.
Initial download of the metrics may take a while.