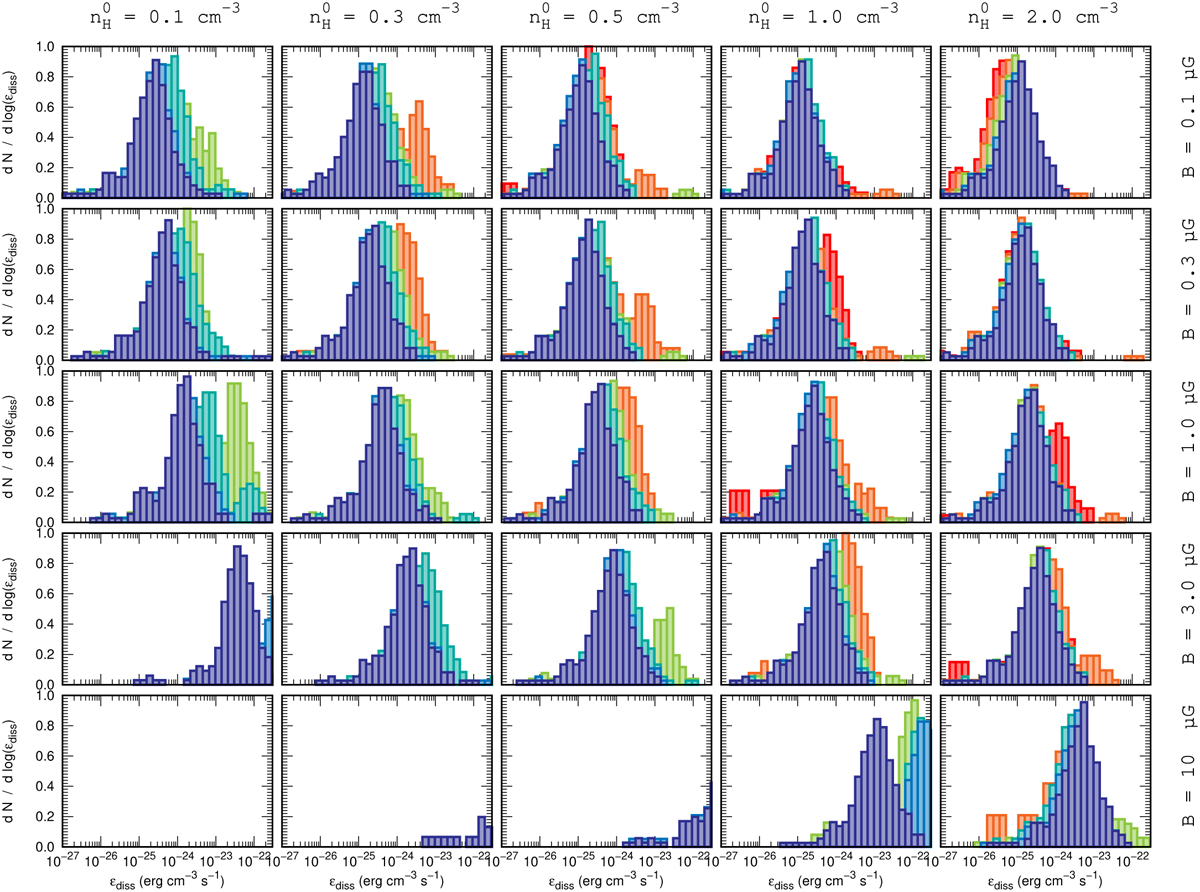
Fig. 11
Download original image
Same as Fig. 10 but for a pre-shock density varying between 0.1 and 2 cm−3 (from left to right), a strength of pre-shock magnetic field varying between 0.1 and 10 μG (from top to bottom), and six values of shock velocity: 20 (red), 40 (orange), 60 (green), 80 (turquoise), 100 (light blue), and 120 (dark blue) km s−1. For coherence, the colour code is the same than that used in Fig. 8. In many cases, only the last distribution (corresponding to VS = 120 km s−1) is visible, because those obtained at lower velocities are identical and hidden behind it. The bottom left panels are empty because the distributions fall outside the range of dissipation rates displayed.
Current usage metrics show cumulative count of Article Views (full-text article views including HTML views, PDF and ePub downloads, according to the available data) and Abstracts Views on Vision4Press platform.
Data correspond to usage on the plateform after 2015. The current usage metrics is available 48-96 hours after online publication and is updated daily on week days.
Initial download of the metrics may take a while.