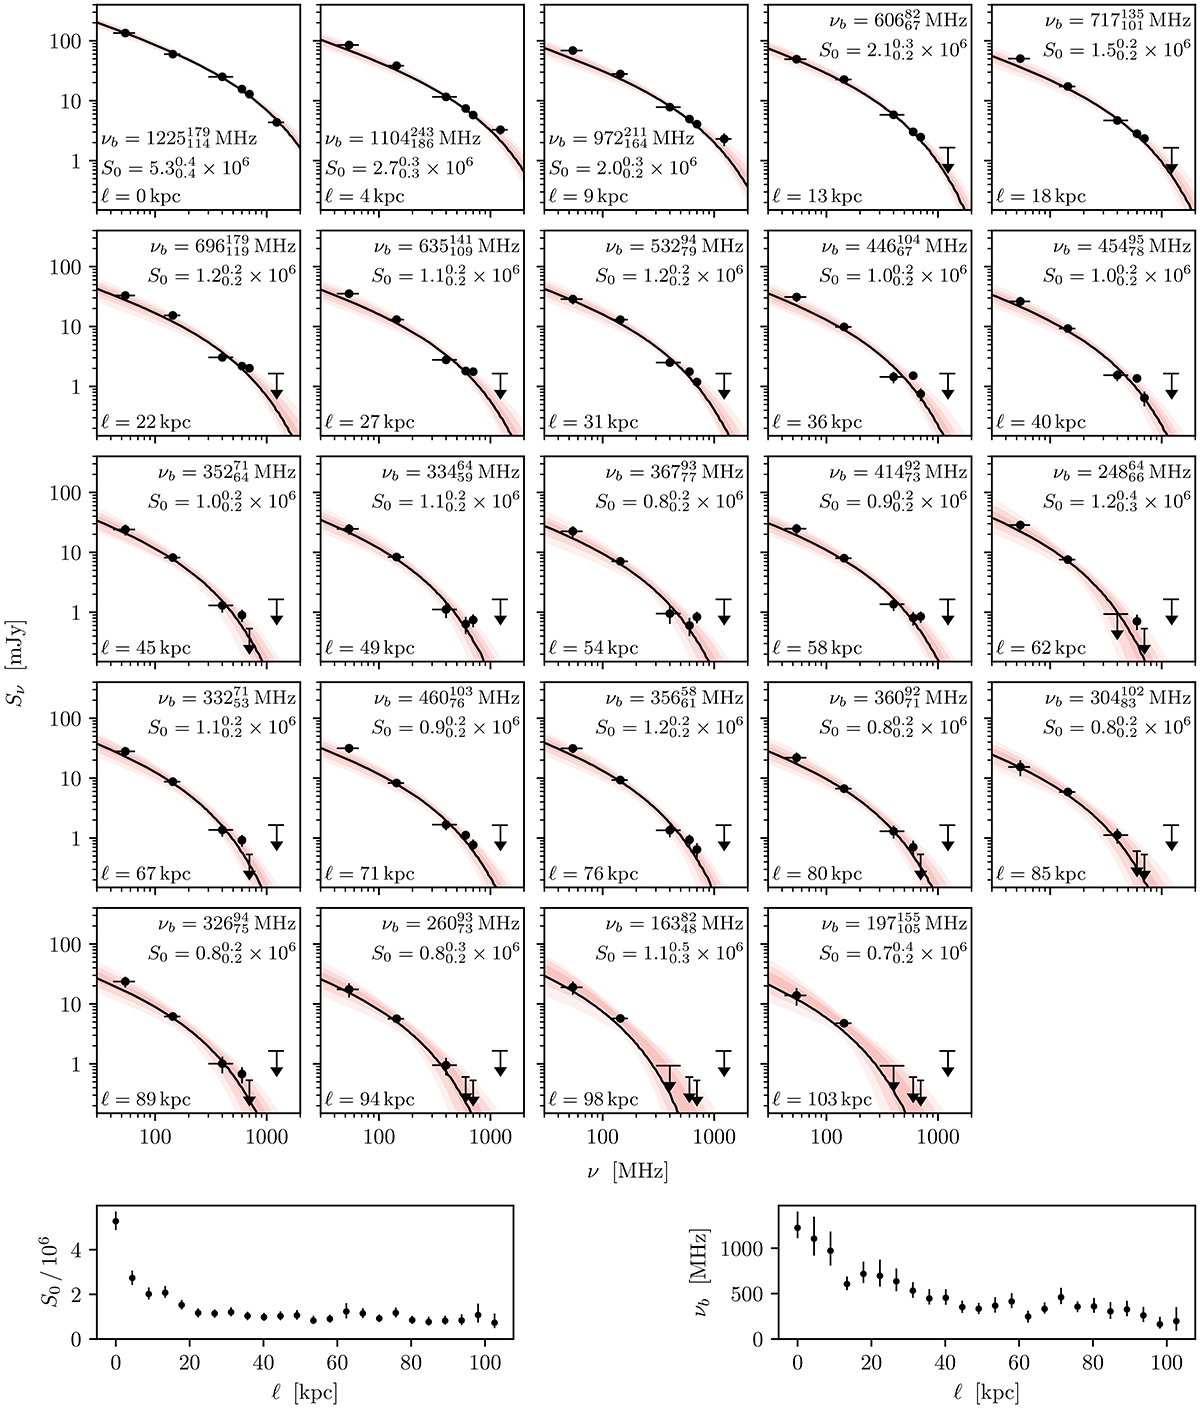
Fig. 6.
Download original image
Radio continuum spectral-fitting results. Top: radio continuum spectra as a function of distance along the stripped tail. Spectra are extracted from the apertures shown in Fig 6, and distance along the tail increases in each panel from left-to-right and top-to-bottom. Measured flux densities are shown with the black data points and the best-fit spectral model is shown by the solid black line. Red shading shows the 68, 95, and 99.7 per cent model credible regions. Bottom: best-fit JP model parameters (normalization and break frequency) as a function of distance along the tail.
Current usage metrics show cumulative count of Article Views (full-text article views including HTML views, PDF and ePub downloads, according to the available data) and Abstracts Views on Vision4Press platform.
Data correspond to usage on the plateform after 2015. The current usage metrics is available 48-96 hours after online publication and is updated daily on week days.
Initial download of the metrics may take a while.