Fig. 2.
Download original image
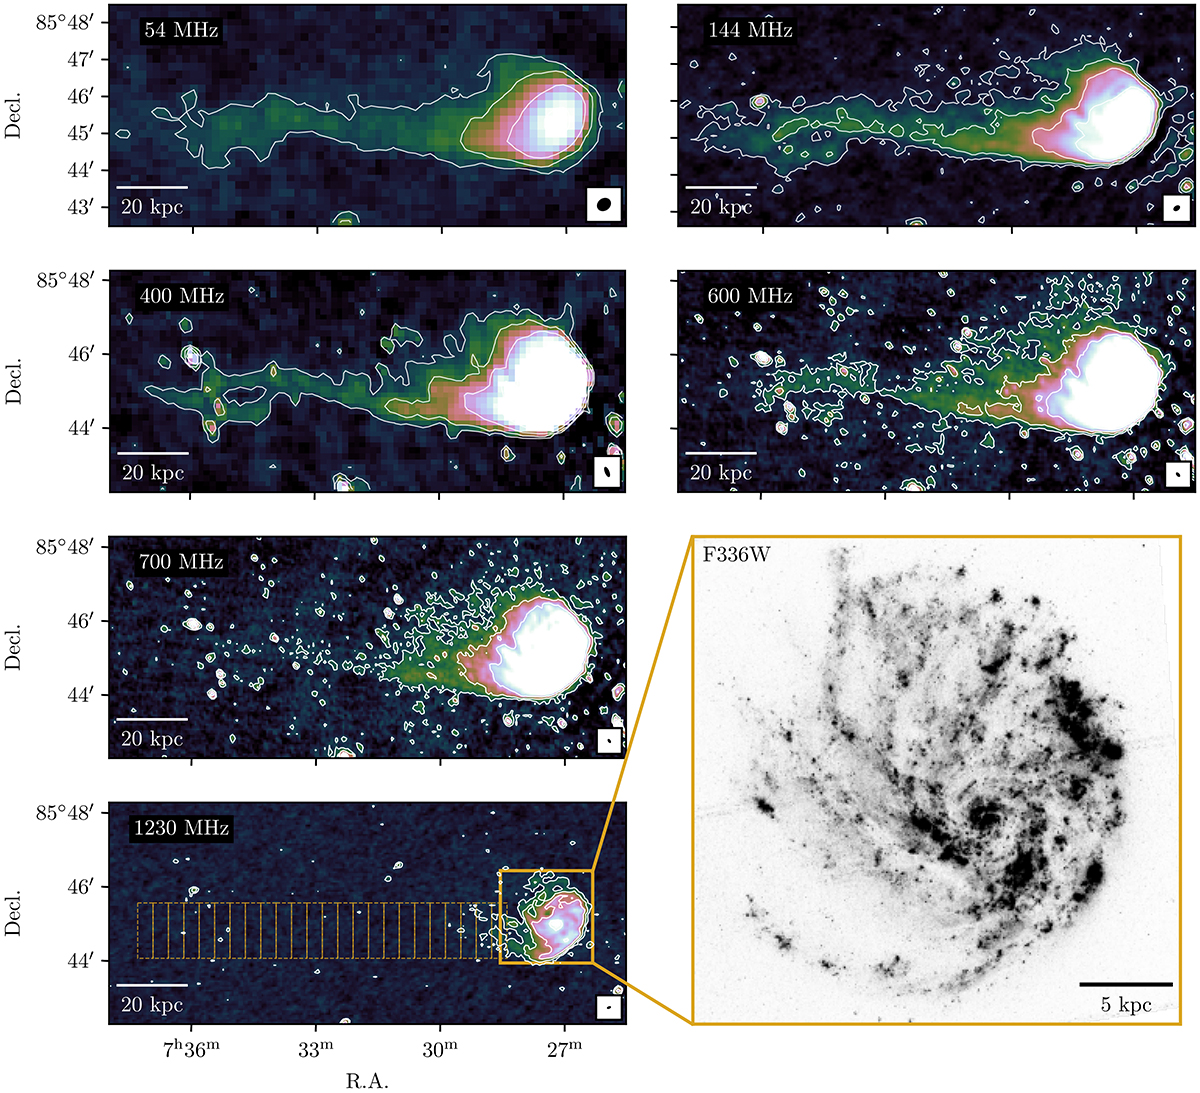
Radio images used in this work, increasing in frequency from left to right and top to bottom. Images are shown with an Asinh stretch set to highlight the extended tail, detailed images of the galaxy disc are shown in Fig. 4. Contour levels begin at 3 × rms and increase by factors of three. Each panel shows the restoring beam shape in the bottom-right corner (see Table 1 for specfic values). For reference, we also show a near-UV image of the galaxy disc from the Hubble Space Telescope (F336W, PI Sell), highlighting the strong star formation on the western edge of the disc. The apertures shown in the bottom-left panel are used to extract radio spectra along the tail (see Sect. 4)
Current usage metrics show cumulative count of Article Views (full-text article views including HTML views, PDF and ePub downloads, according to the available data) and Abstracts Views on Vision4Press platform.
Data correspond to usage on the plateform after 2015. The current usage metrics is available 48-96 hours after online publication and is updated daily on week days.
Initial download of the metrics may take a while.