Fig. 1.
Download original image
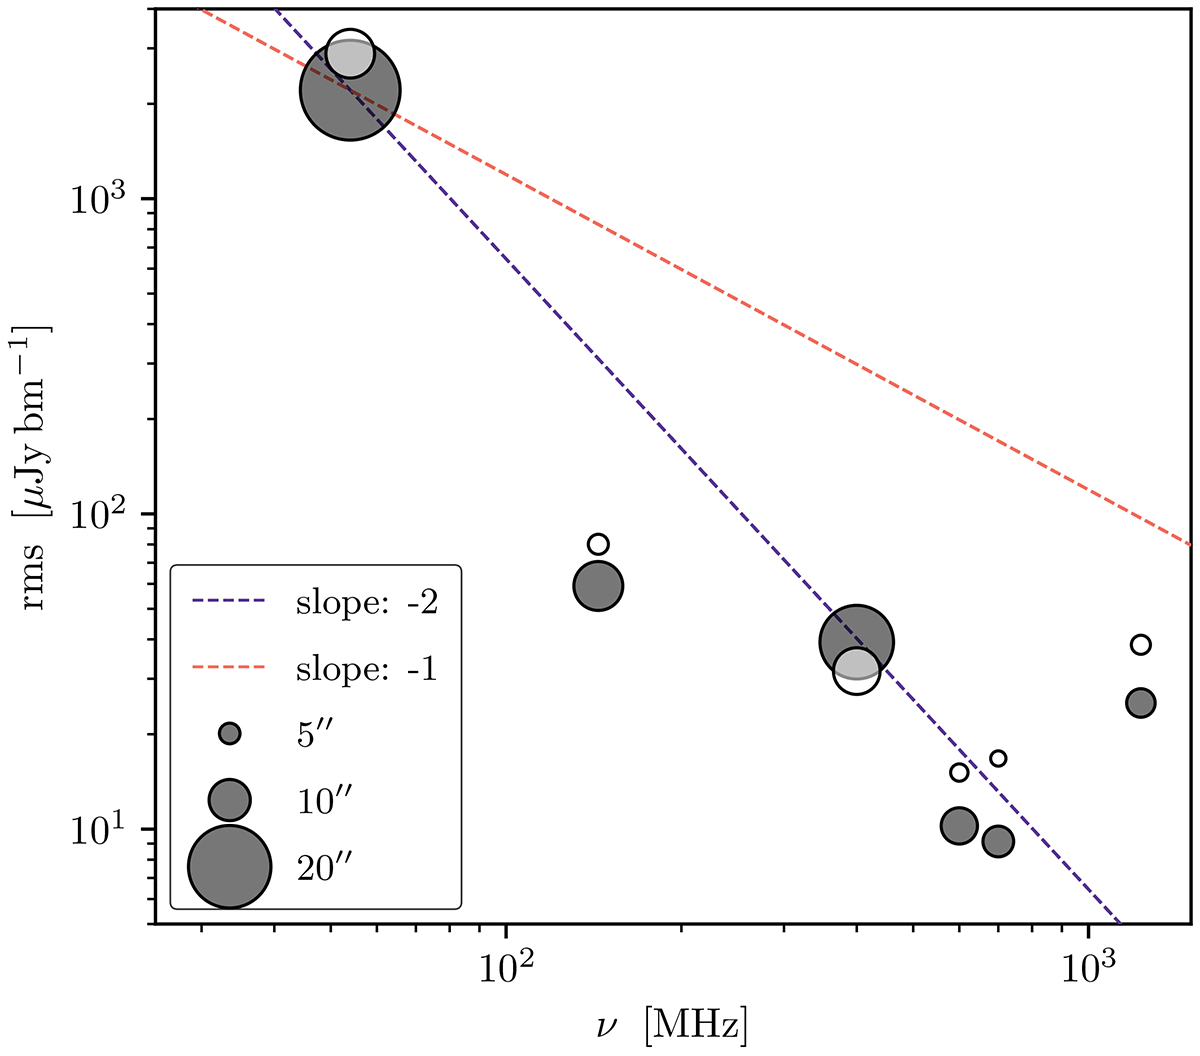
Noise in our radio maps as a function of frequency for the radio continuum images used in this work. The grey markers correspond to the low-resolution images and the white markers correspond to the high resolution images. The marker size scales with the size of the major axis of the restoring beam. For reference, lines corresponding to spectral indices of −1 and −2 are shown through our lowest frequency band.
Current usage metrics show cumulative count of Article Views (full-text article views including HTML views, PDF and ePub downloads, according to the available data) and Abstracts Views on Vision4Press platform.
Data correspond to usage on the plateform after 2015. The current usage metrics is available 48-96 hours after online publication and is updated daily on week days.
Initial download of the metrics may take a while.