Fig. 7.
Download original image
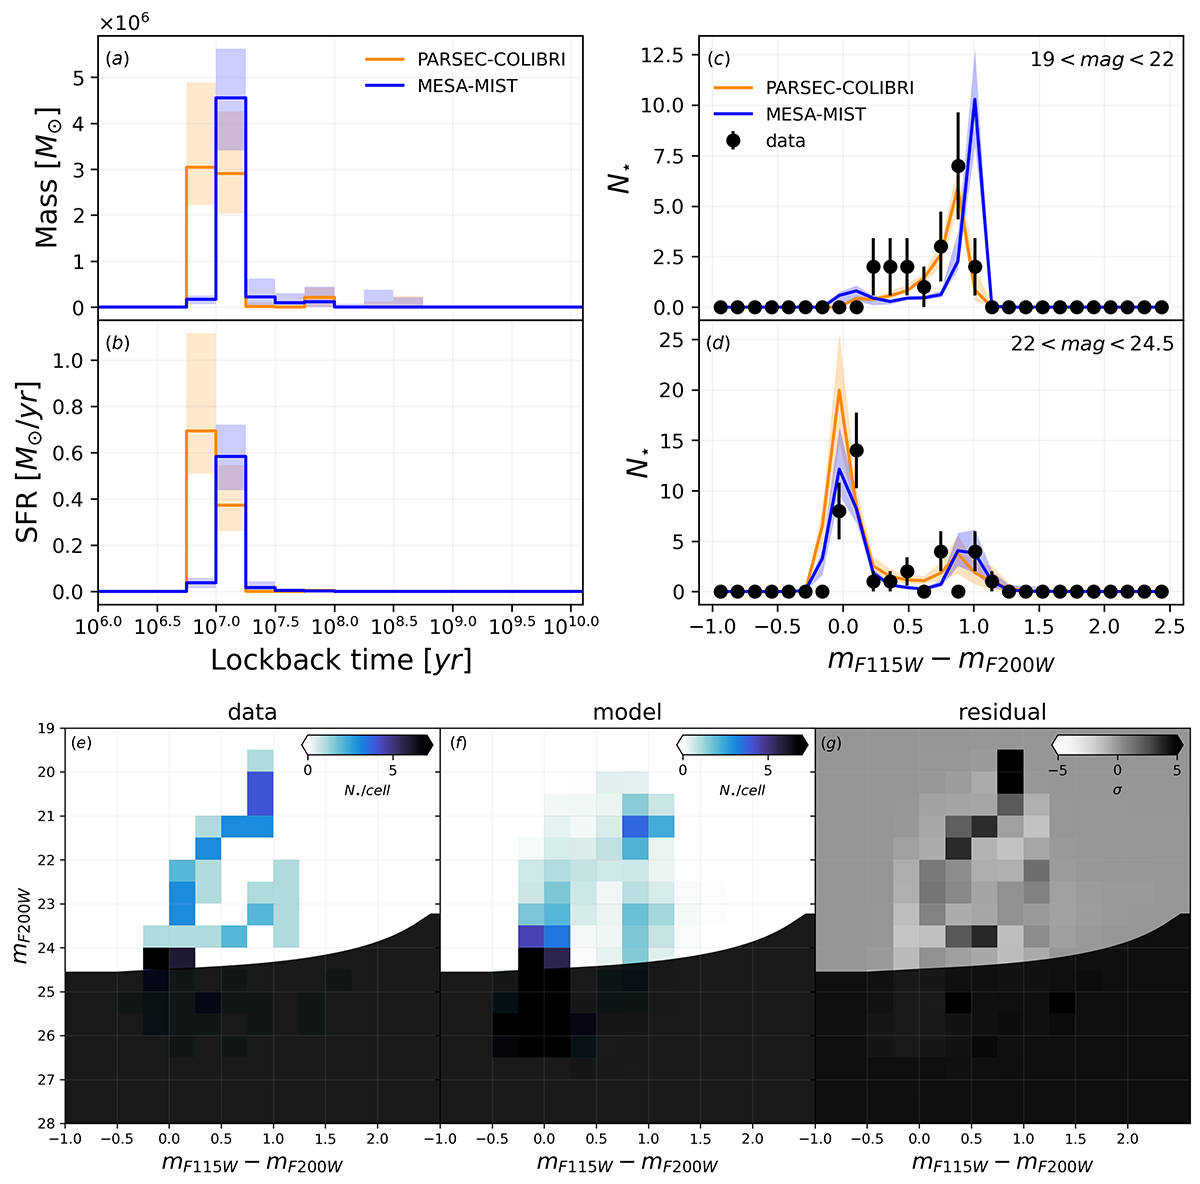
SFERA 2.0 results for region 1. Panels (a)-(b): recovered SFH and mass using PARSEC-COLIBRI (orange line) and MIST (blue line) isochrones. The shaded areas mark the 16–84 percentiles. Panels (c)-(d): data (black points) vs. model CMD luminosity functions for different luminosity intervals (indicated on the upper-right). Again, the PARSEC-COLIBRI solution is in orange, while the MIST in blue. Panels (e)-(g): observational CMD, SFERA 2.0 best fit model CMD and normalized residuals for each CMD cell (![]() ). The diagrams are color-coded according to the number of stars in each cell (see color-bar in the upper-right corner). The dark-shade masks the region of the CMD that is below our fiducial 50% completeness limit. This region is excluded from the fitting procedure.
). The diagrams are color-coded according to the number of stars in each cell (see color-bar in the upper-right corner). The dark-shade masks the region of the CMD that is below our fiducial 50% completeness limit. This region is excluded from the fitting procedure.
Current usage metrics show cumulative count of Article Views (full-text article views including HTML views, PDF and ePub downloads, according to the available data) and Abstracts Views on Vision4Press platform.
Data correspond to usage on the plateform after 2015. The current usage metrics is available 48-96 hours after online publication and is updated daily on week days.
Initial download of the metrics may take a while.