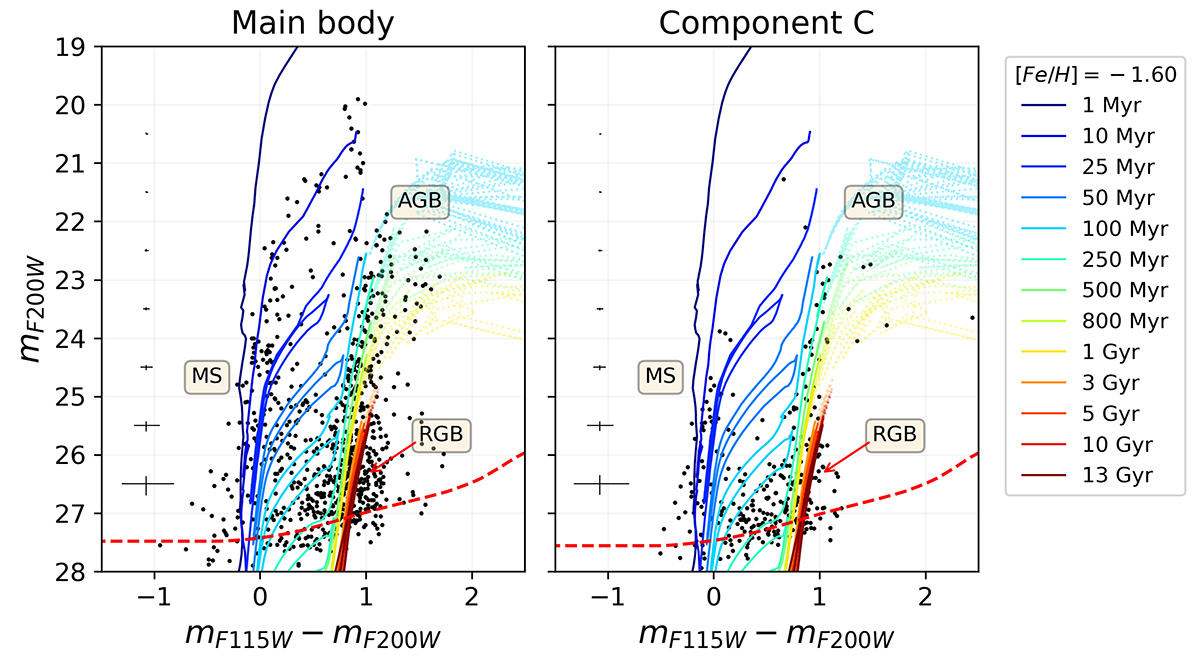
Fig. 4.
Download original image
mF200W vs. mF115W − mF200W color-magnitude diagrams of I Zw 18’s main body (left panel) and Component C (right panel). Different stellar evolutionary phases are visible (see discussion in Sect. 3.1). PARSEC-COLIBRI isochrones (assuming [Fe/H] = −1.60, (m − M0) = 31.3 and E(B − V) = 0.032) are over-plotted and color-coded by their age (see the legend in the upper right corner). The main stellar evolutionary phases are labeled. Error bars on the left-hand side represent photometric uncertainties at various magnitudes, assuming mF115W − mF200W = 1. The red-dashed line indicates the 50% completeness limit.
Current usage metrics show cumulative count of Article Views (full-text article views including HTML views, PDF and ePub downloads, according to the available data) and Abstracts Views on Vision4Press platform.
Data correspond to usage on the plateform after 2015. The current usage metrics is available 48-96 hours after online publication and is updated daily on week days.
Initial download of the metrics may take a while.