Open Access
Fig. 3.
Download original image
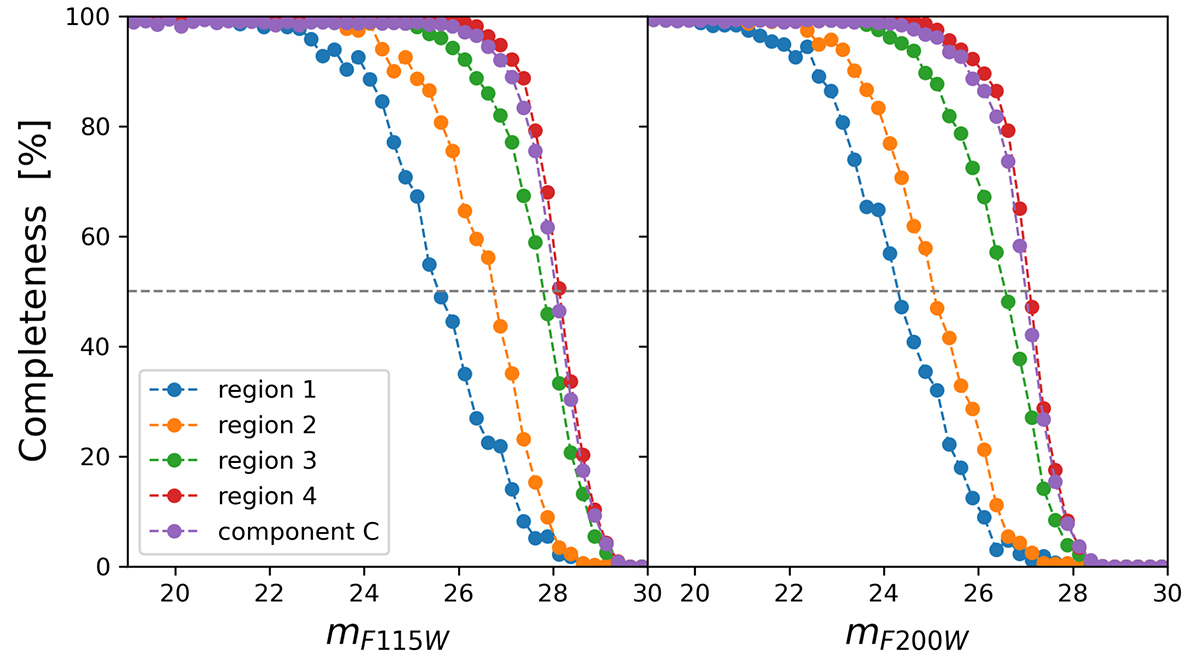
Averaged photometric completeness from our AST, as a function of magnitude in the F115W (left panel) and F200W (right panel) filters. Different regions of the galaxy (see Fig. 1) are highlighted in different colors (see legend in the bottom-left corner). The dashed gray line marks the 50% completeness limit.
Current usage metrics show cumulative count of Article Views (full-text article views including HTML views, PDF and ePub downloads, according to the available data) and Abstracts Views on Vision4Press platform.
Data correspond to usage on the plateform after 2015. The current usage metrics is available 48-96 hours after online publication and is updated daily on week days.
Initial download of the metrics may take a while.