Open Access
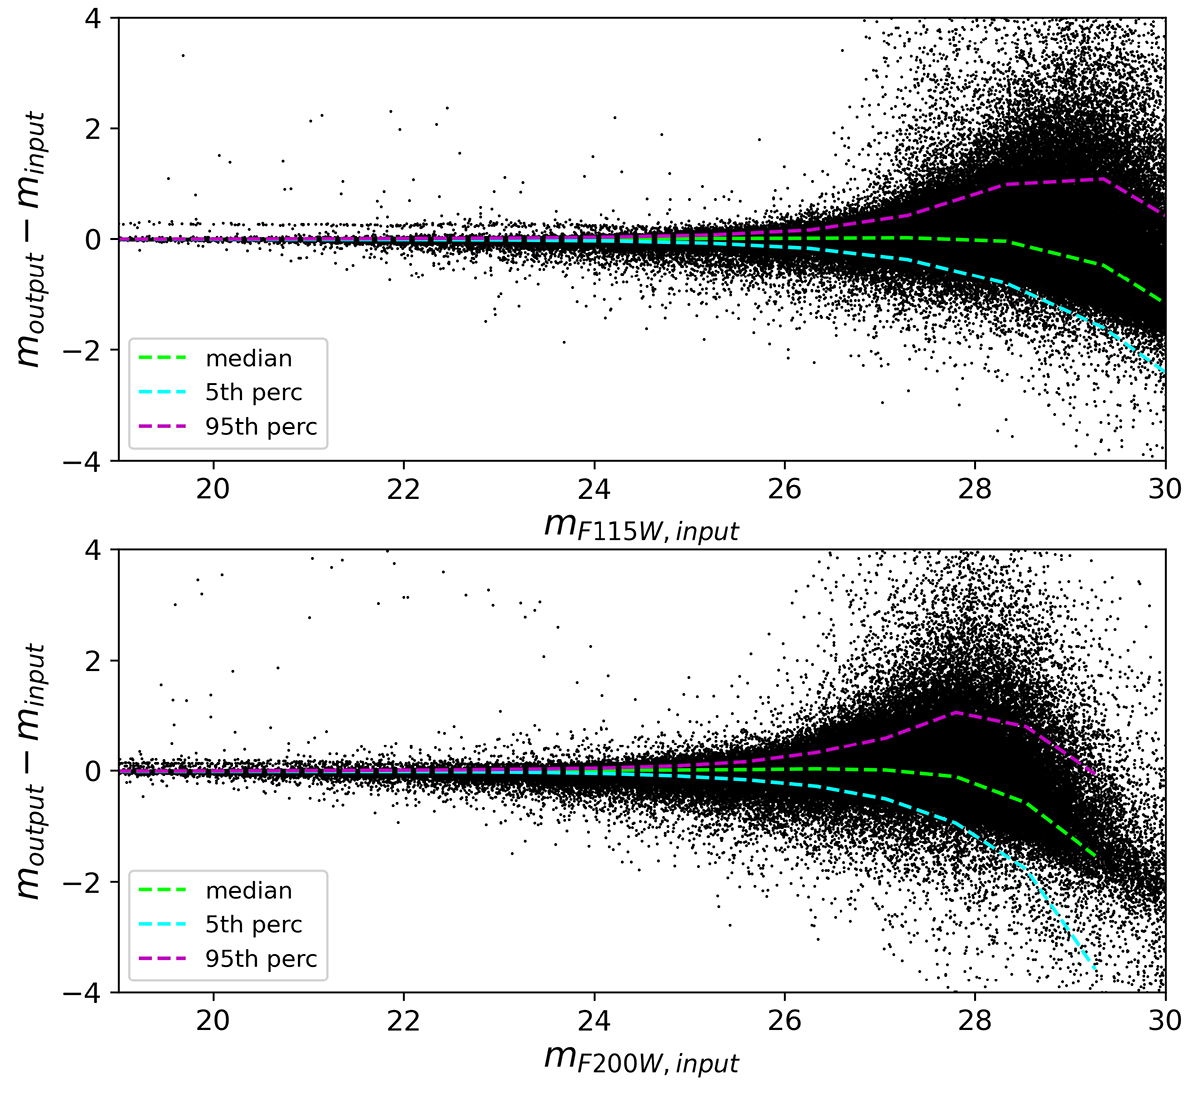
Fig. 2.
Download original image
moutput − minput vs. minput distribution of the artificial stars in F115W (upper panel) and F200W (bottom panel) filter. The green-dashed lines is the median of the distribution, while the cyan and the pink ones show the 5th and 95th percentile respectively.
Current usage metrics show cumulative count of Article Views (full-text article views including HTML views, PDF and ePub downloads, according to the available data) and Abstracts Views on Vision4Press platform.
Data correspond to usage on the plateform after 2015. The current usage metrics is available 48-96 hours after online publication and is updated daily on week days.
Initial download of the metrics may take a while.