Fig. 9
Download original image
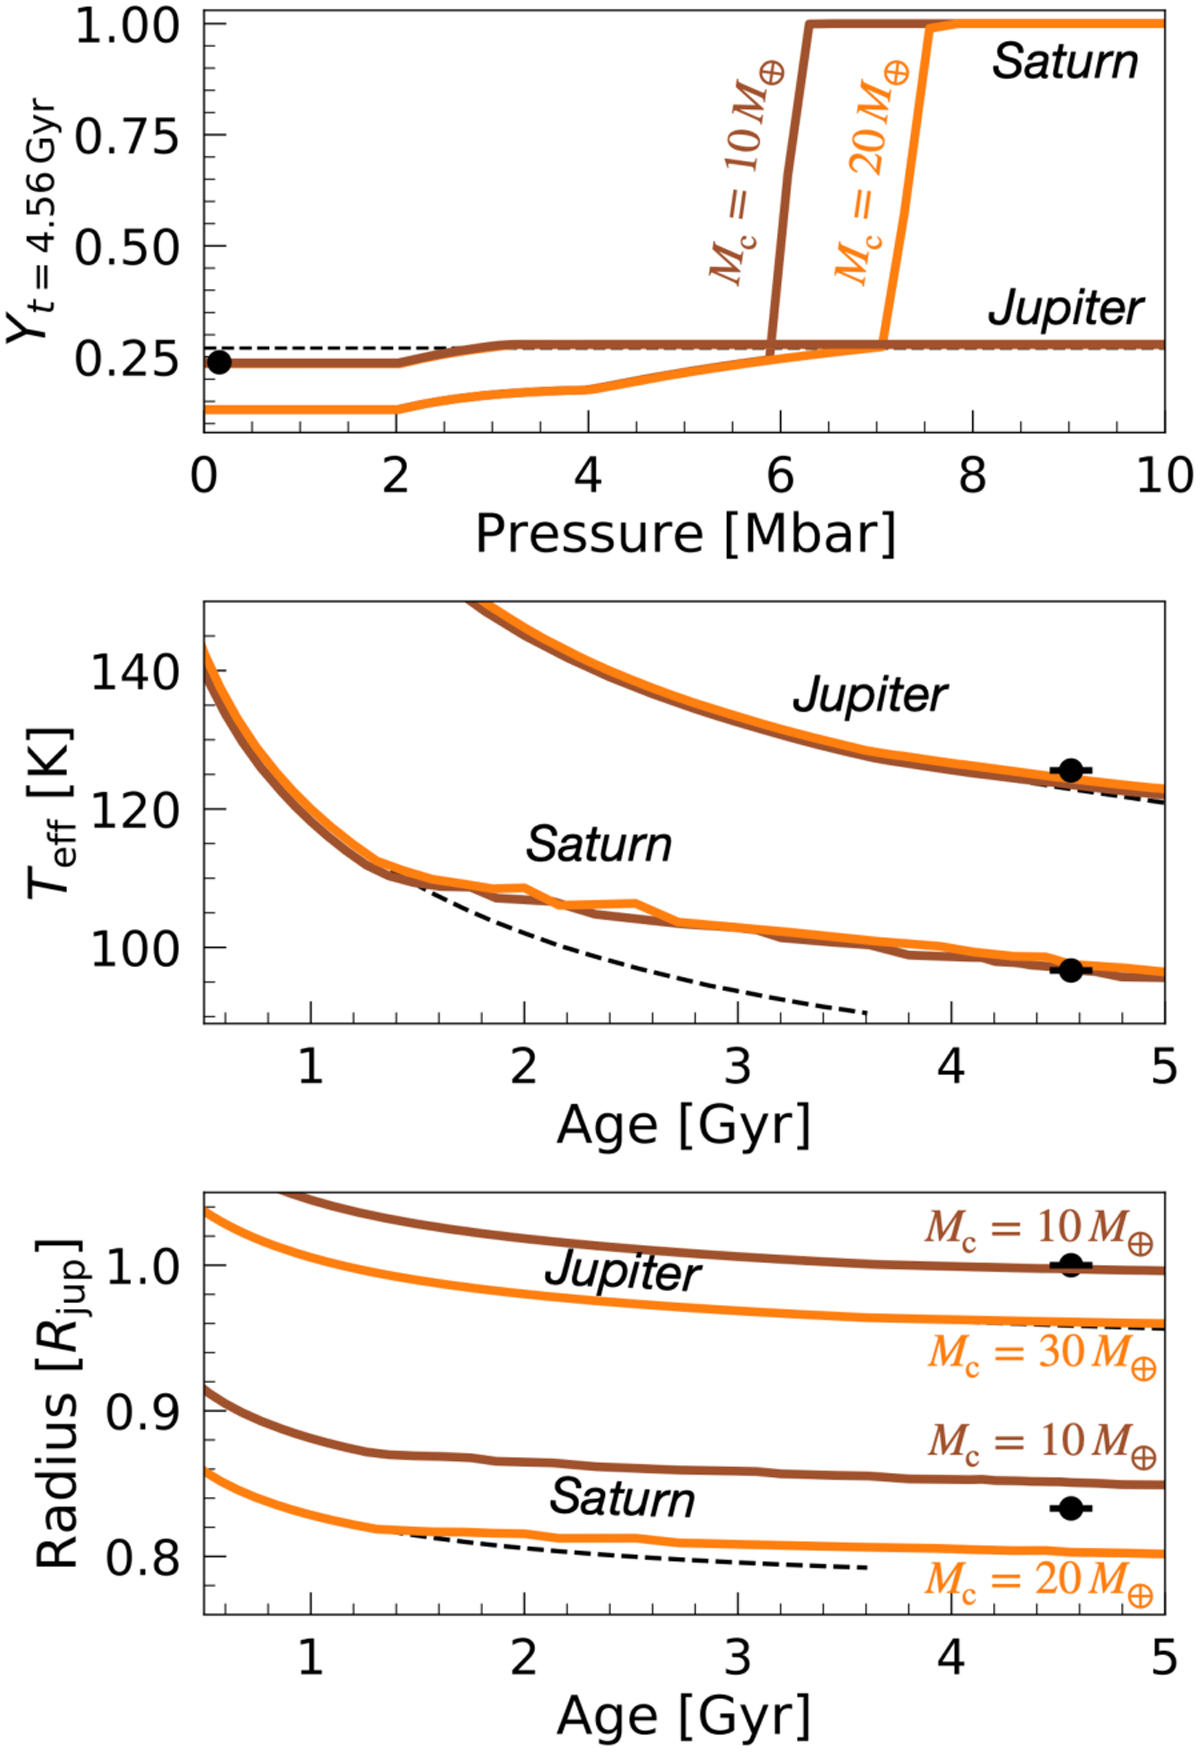
Effect of the core mass on the evolution of Jupiter and Saturn. The calculations use the SR2018 phase diagram with Toffset = 350 K. Top panel: present-day helium mass fraction as a function of pressure. The black dot shows the Galileo measured value. Middle panel: effective temperature as a function of age. Black dots show the measured effective temperature. Bottom panel: planet’s radius as a function of age. The black dashed lines correspond to homogeneous evolution calculations. Black dots show the measured radii and the errorbar the uncertainty in age.
Current usage metrics show cumulative count of Article Views (full-text article views including HTML views, PDF and ePub downloads, according to the available data) and Abstracts Views on Vision4Press platform.
Data correspond to usage on the plateform after 2015. The current usage metrics is available 48-96 hours after online publication and is updated daily on week days.
Initial download of the metrics may take a while.