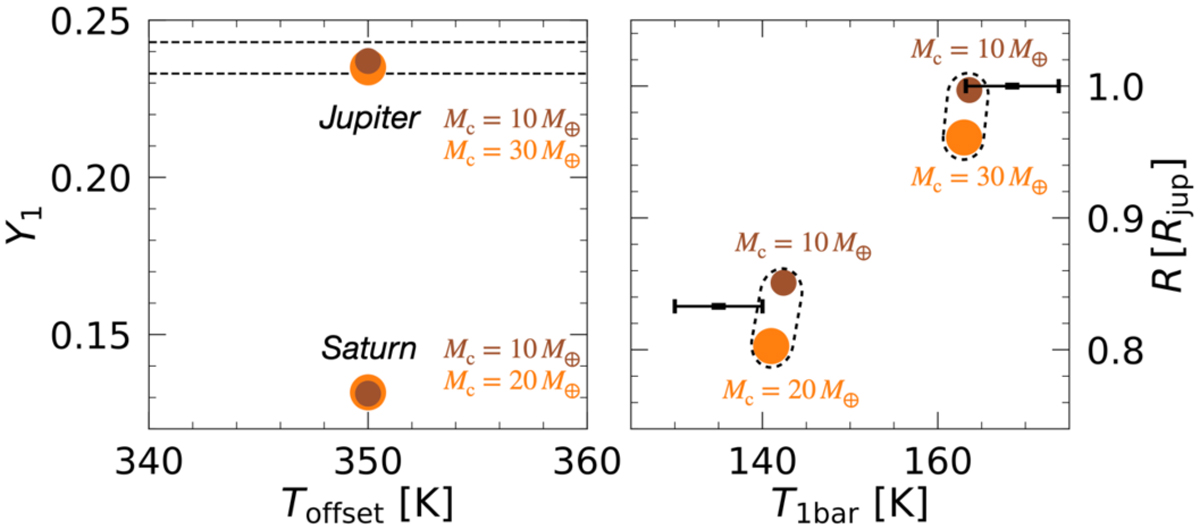
Fig. 8

Download original image
Comparison of models with different core masses but when applying the same temperature offset. The calculations use the SR2018 phase diagram with Toffset = 350 K. Displayed quantities are at t = 4.56 Gyr. Left panel: atmospheric helium mass fraction as a function of the temperature offset. The horizontal dashed lines show the upper and lower bounds of the observed value of Y1. Right panel: planetary adius as a function of the 1 bar temperature. The black errorbars show the observed radii and 1 bar temperatures of Jupiter and Saturn (see Fig. B.1 for details about these measured values). The dashed lines show the possible range of models with core masses that fall between the two values we considered here.
Current usage metrics show cumulative count of Article Views (full-text article views including HTML views, PDF and ePub downloads, according to the available data) and Abstracts Views on Vision4Press platform.
Data correspond to usage on the plateform after 2015. The current usage metrics is available 48-96 hours after online publication and is updated daily on week days.
Initial download of the metrics may take a while.


