Fig. 5
Download original image
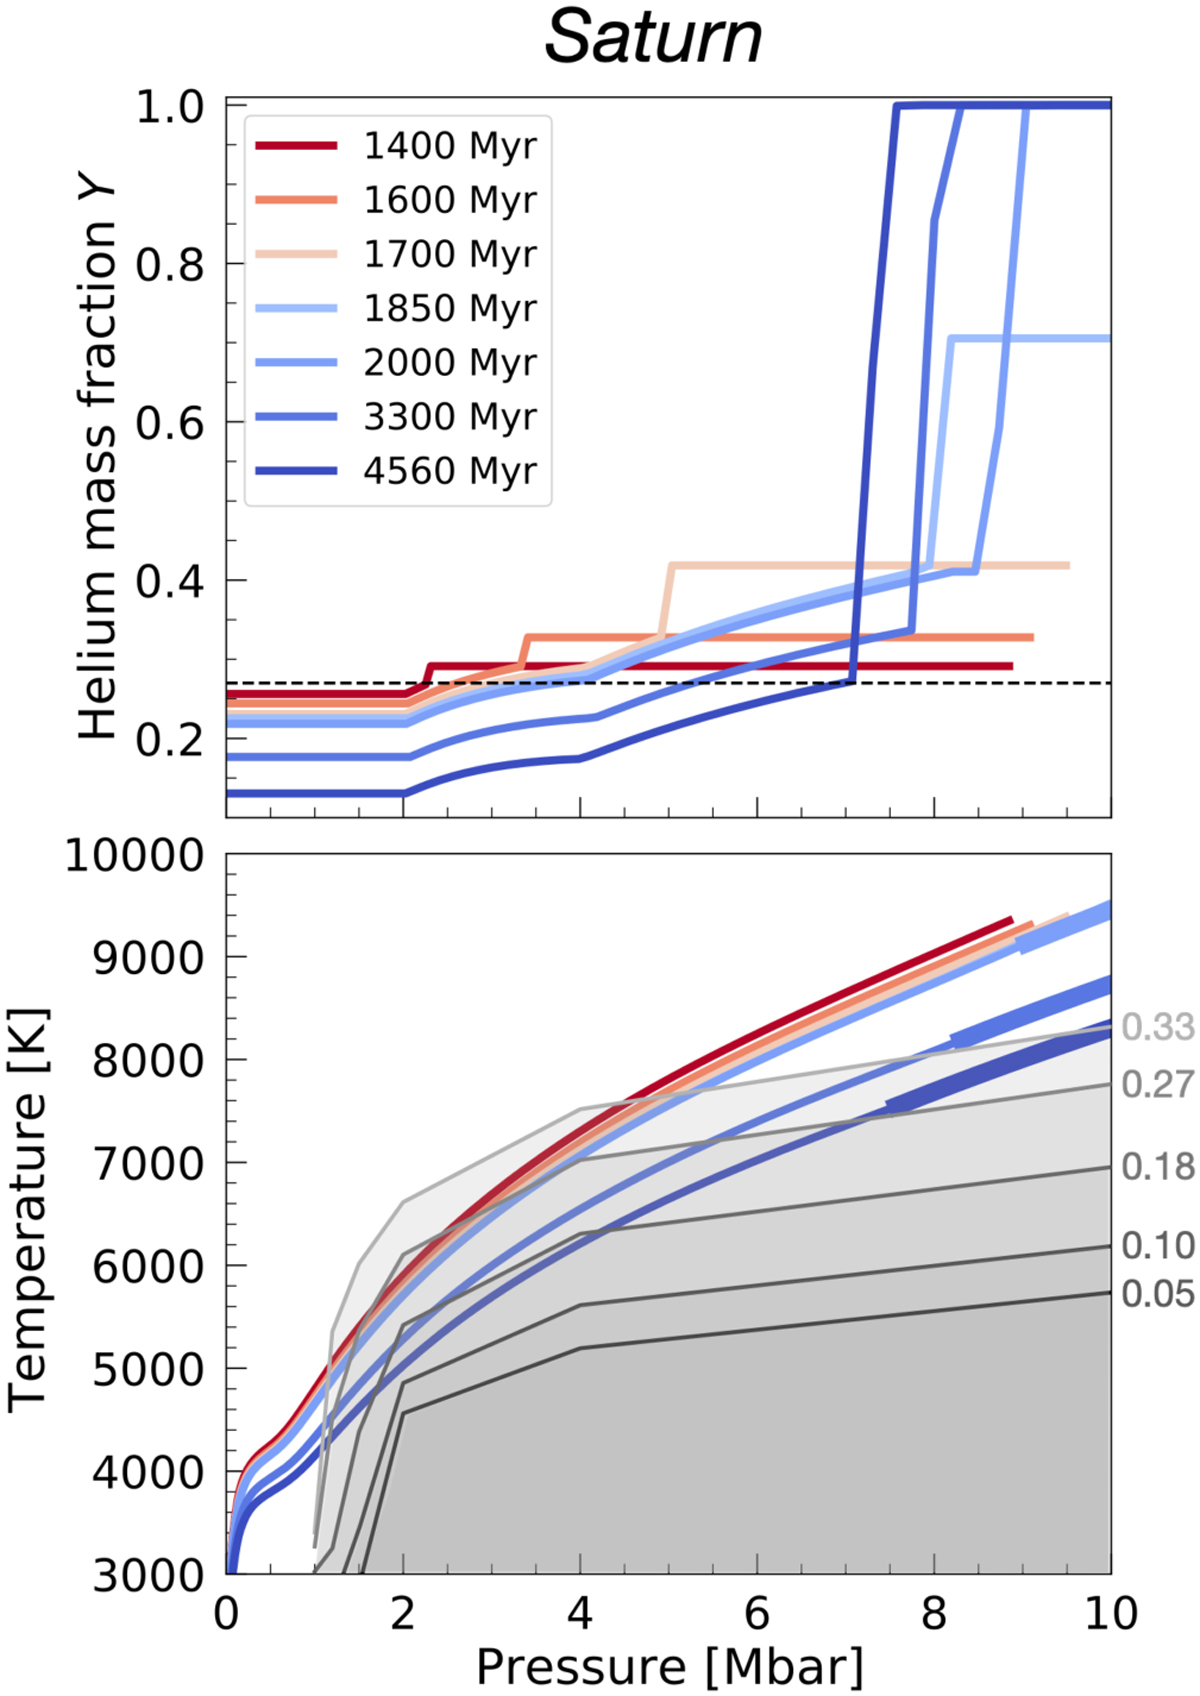
Growth of the helium ocean in Saturn. The calculations come from the results of Saturn’s evolution using the SR2018 phase diagram with Toffset = 350 K (Sect. 3.1.2). Top panel: Helium mass fraction at different ages. The black dashed line corresponds to the protosolar value at Y = 0.27. At t = 2 000 Myr, the helium ocean is already there and starts growing. Bottom panel: temperature-pressure profiles of Saturn’s envelope at these ages. Thick portions of the profiles indicate the helium ocean region. Phase curves from the SR2018 phase diagram with Toffset = 350 K are shown with grey lines for Y = 0.33, 0.27, 0.18, 0.1 and 0.05. Grey-shaded areas correspond to the de-mixing regions.
Current usage metrics show cumulative count of Article Views (full-text article views including HTML views, PDF and ePub downloads, according to the available data) and Abstracts Views on Vision4Press platform.
Data correspond to usage on the plateform after 2015. The current usage metrics is available 48-96 hours after online publication and is updated daily on week days.
Initial download of the metrics may take a while.