Fig. 3
Download original image
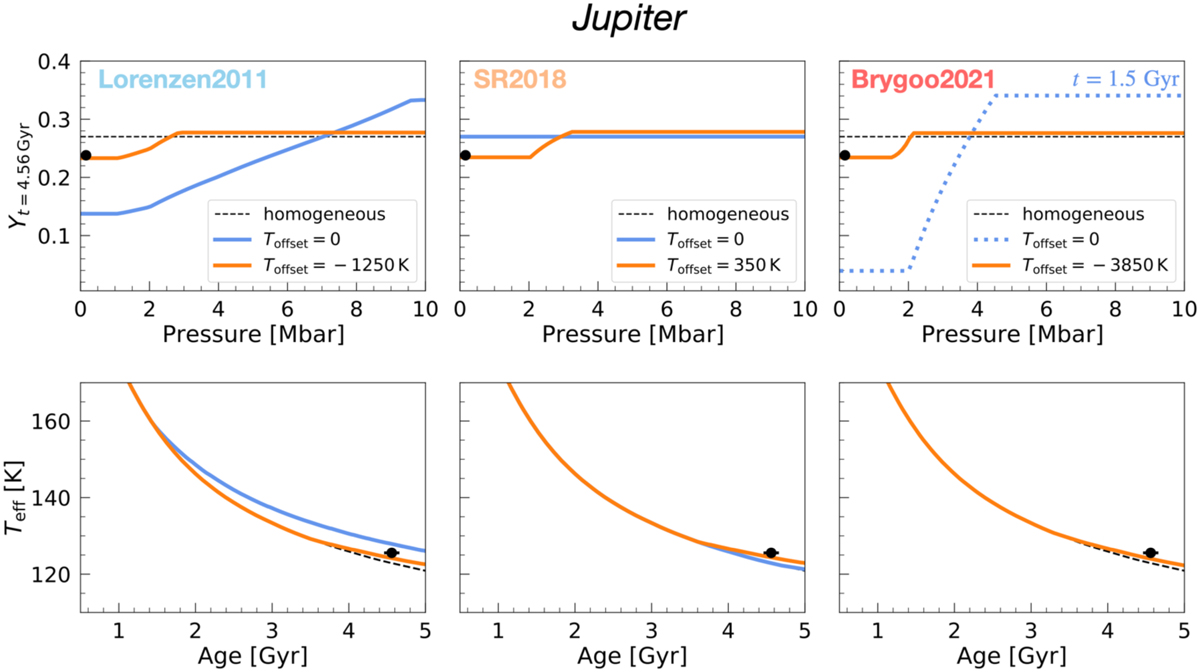
Evolutionary calculations of lupiter. Top panels: present-day helium mass fraction as a function of pressure. The pressure range corresponds to the relevant region where de-mixing takes place. Bottom panels: effective temperature as a function of age. Columns (from left to right) correspond to results where we applied the Lorenzen2011, SR2018 and Brygoo2021 phase diagrams, respectively. For comparison, black dashed lines show homogeneous evolution calculations, namely with no de-mixing. Blue solid lines show evolution calculations coupled with the original phase diagrams, namely with no temperature offset. For Brygoo2021, the blue line is dotted and shows the distribution at t = 1.5 Gyr. The orange solid lines show results where a temperature offset, Toffset, was applied to the corresponding phase diagram in order to fit the abundance of helium measured by Galileo (represented by the black dot on top panels). The black dot in the bottom panels corresponds to the measured effective temperature and the errorbar refers to the uncertainty in age.
Current usage metrics show cumulative count of Article Views (full-text article views including HTML views, PDF and ePub downloads, according to the available data) and Abstracts Views on Vision4Press platform.
Data correspond to usage on the plateform after 2015. The current usage metrics is available 48-96 hours after online publication and is updated daily on week days.
Initial download of the metrics may take a while.