Fig. B.1
Download original image
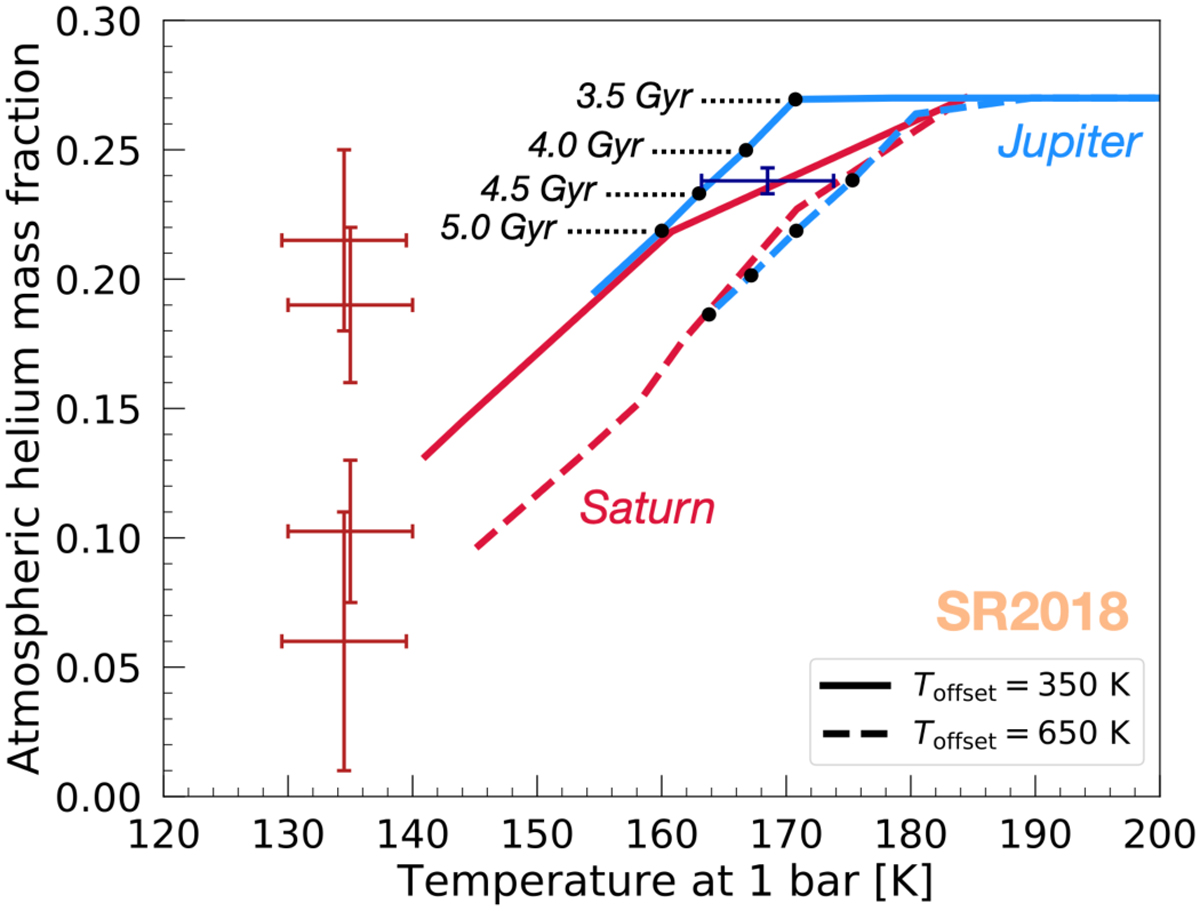
Inferred atmospheric helium mass fraction as a function of the 1 bar temperature. Solid lines correspond to our baseline models for Jupiter and Saturn, using SR2018 with Toffset = 350 K. Dashed lines show similar evolution models but with Toffset = 650 K. The blue error-bar corresponds to the Galileo measurement of Yatm (von Zahn et al. 1998) and the Voyager re-estimation of T1bar (Gupta et al. 2022). Red errorbars (from top to bottom) correspond to estimates from Conrath & Gautier (2000),Koskinen & Guerlet (2018),Achterberg & Flasar (2020), Conrath et al. (1984) and the 1 bar temperature from Lindal et al. (1985). Black dots indicate specific ages in the evolution.
Current usage metrics show cumulative count of Article Views (full-text article views including HTML views, PDF and ePub downloads, according to the available data) and Abstracts Views on Vision4Press platform.
Data correspond to usage on the plateform after 2015. The current usage metrics is available 48-96 hours after online publication and is updated daily on week days.
Initial download of the metrics may take a while.