Fig. 11
Download original image
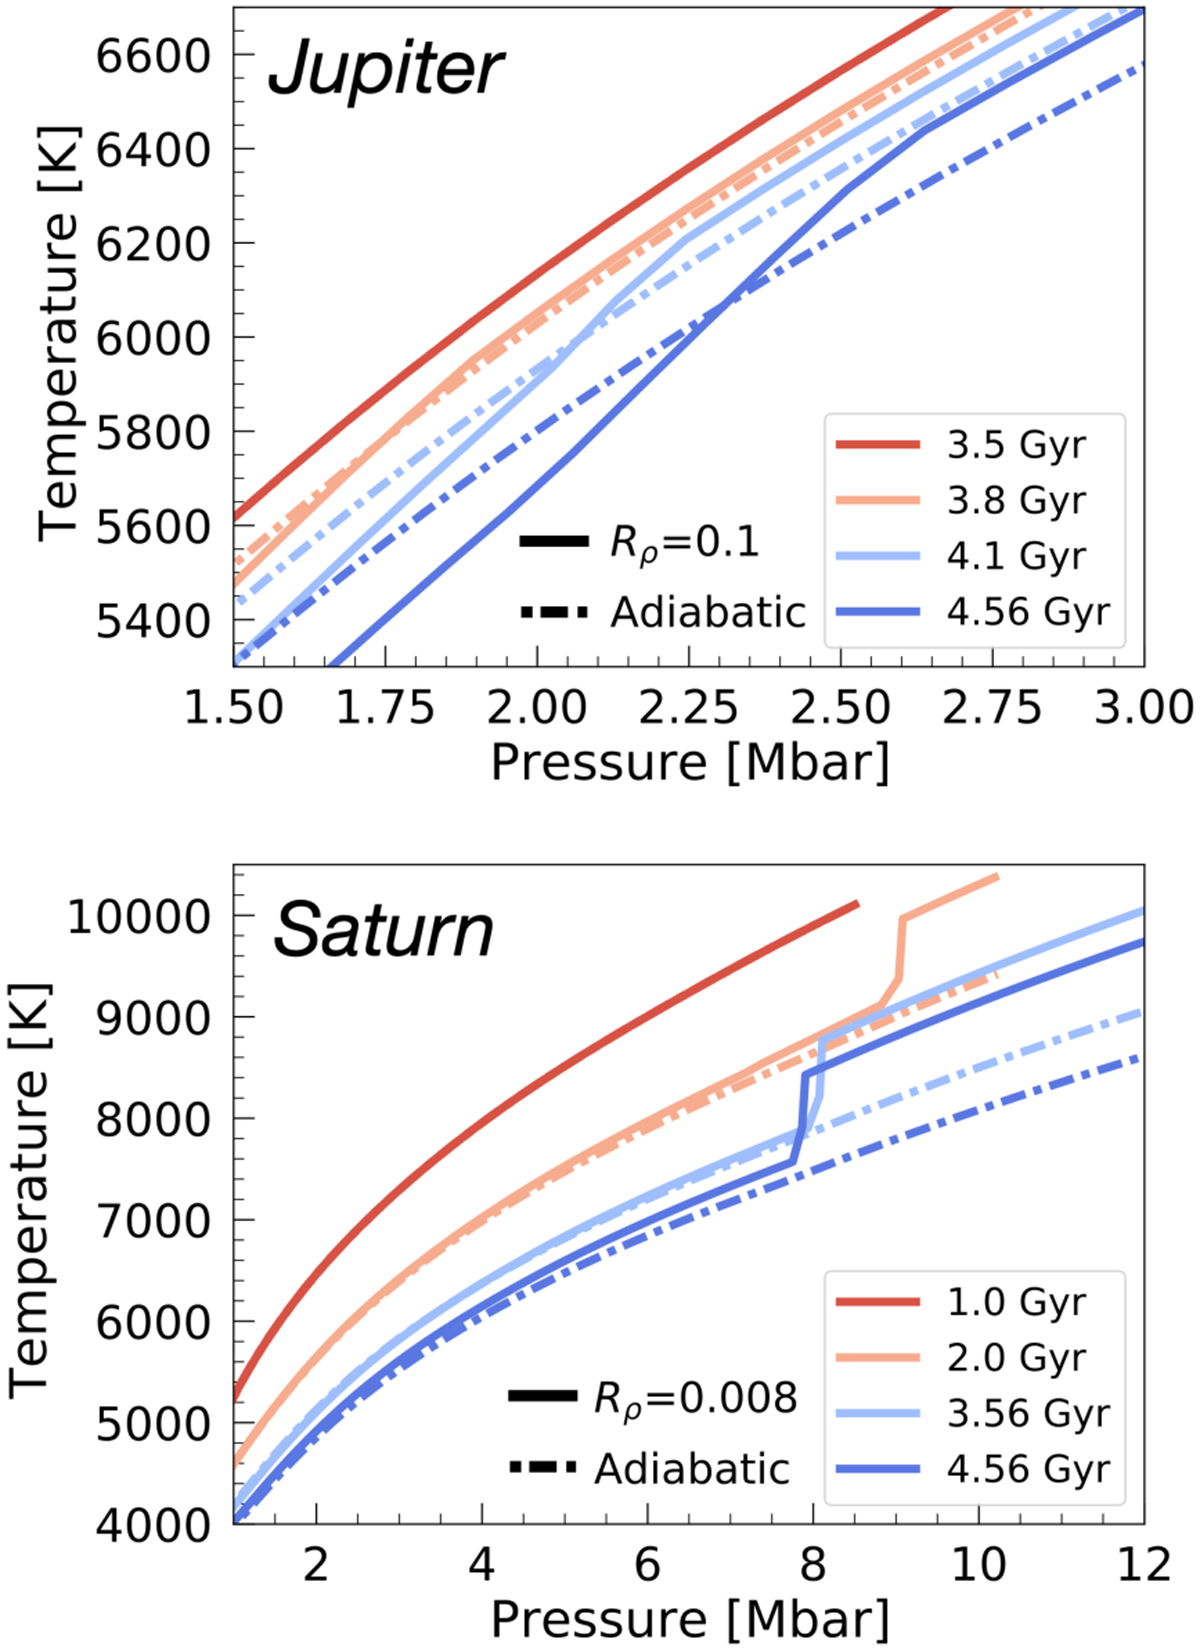
Temperature-pressure profiles of the envelopes of Jupiter and Saturn at different ages, for adiabatic and super-adiabatic interiors. We compare calculations shown on Fig. 10. Dash-dotted lines show T − P profiles of our baseline models, assuming adiabaticity (Rρ = 0). Solid lines show T − P profiles for Rρ = 0.1 for Jupiter (top panel) and Rρ = 0.008 for Saturn (bottom panel).
Current usage metrics show cumulative count of Article Views (full-text article views including HTML views, PDF and ePub downloads, according to the available data) and Abstracts Views on Vision4Press platform.
Data correspond to usage on the plateform after 2015. The current usage metrics is available 48-96 hours after online publication and is updated daily on week days.
Initial download of the metrics may take a while.