Fig. 1
Download original image
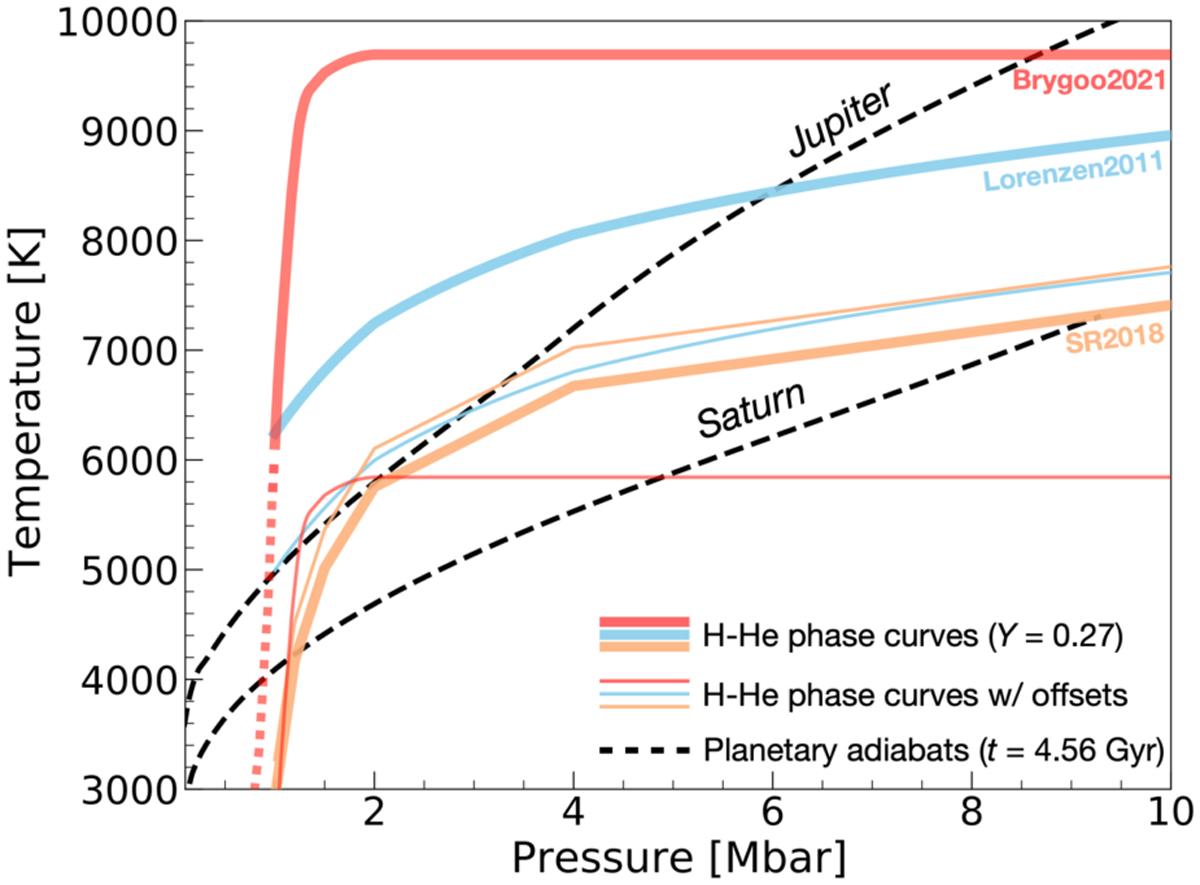
Comparison of immiscibility curves from H-He phase diagrams. The thick solid lines show the phase curves for a solar mixture from ab initio calculations of Lorenzen et al. (2011) and Schöttler & Redmer (2018) and from the laser-shock experiment of Brygoo et al. (2021). The thin solid lines show the same phase curves but with temperature offsets of -1250, +350, and -3850 K, respectively. These offsets correspond to the ones used in Sect. 3.1.1, which are required to fit Jupiter’s evolution to Galileo’s measurement of its atmospheric helium content. The dashed lines correspond to the adiabats of Jupiter and Saturn today (see Sect. 3 for details). As the region of de-mixing was considered only at pressures greater than 1 Mbar in our models, the region of the Brygoo2021 phase diagram below 1 Mbar was not used (shown with the dotted red line).
Current usage metrics show cumulative count of Article Views (full-text article views including HTML views, PDF and ePub downloads, according to the available data) and Abstracts Views on Vision4Press platform.
Data correspond to usage on the plateform after 2015. The current usage metrics is available 48-96 hours after online publication and is updated daily on week days.
Initial download of the metrics may take a while.