Fig. 8

Download original image
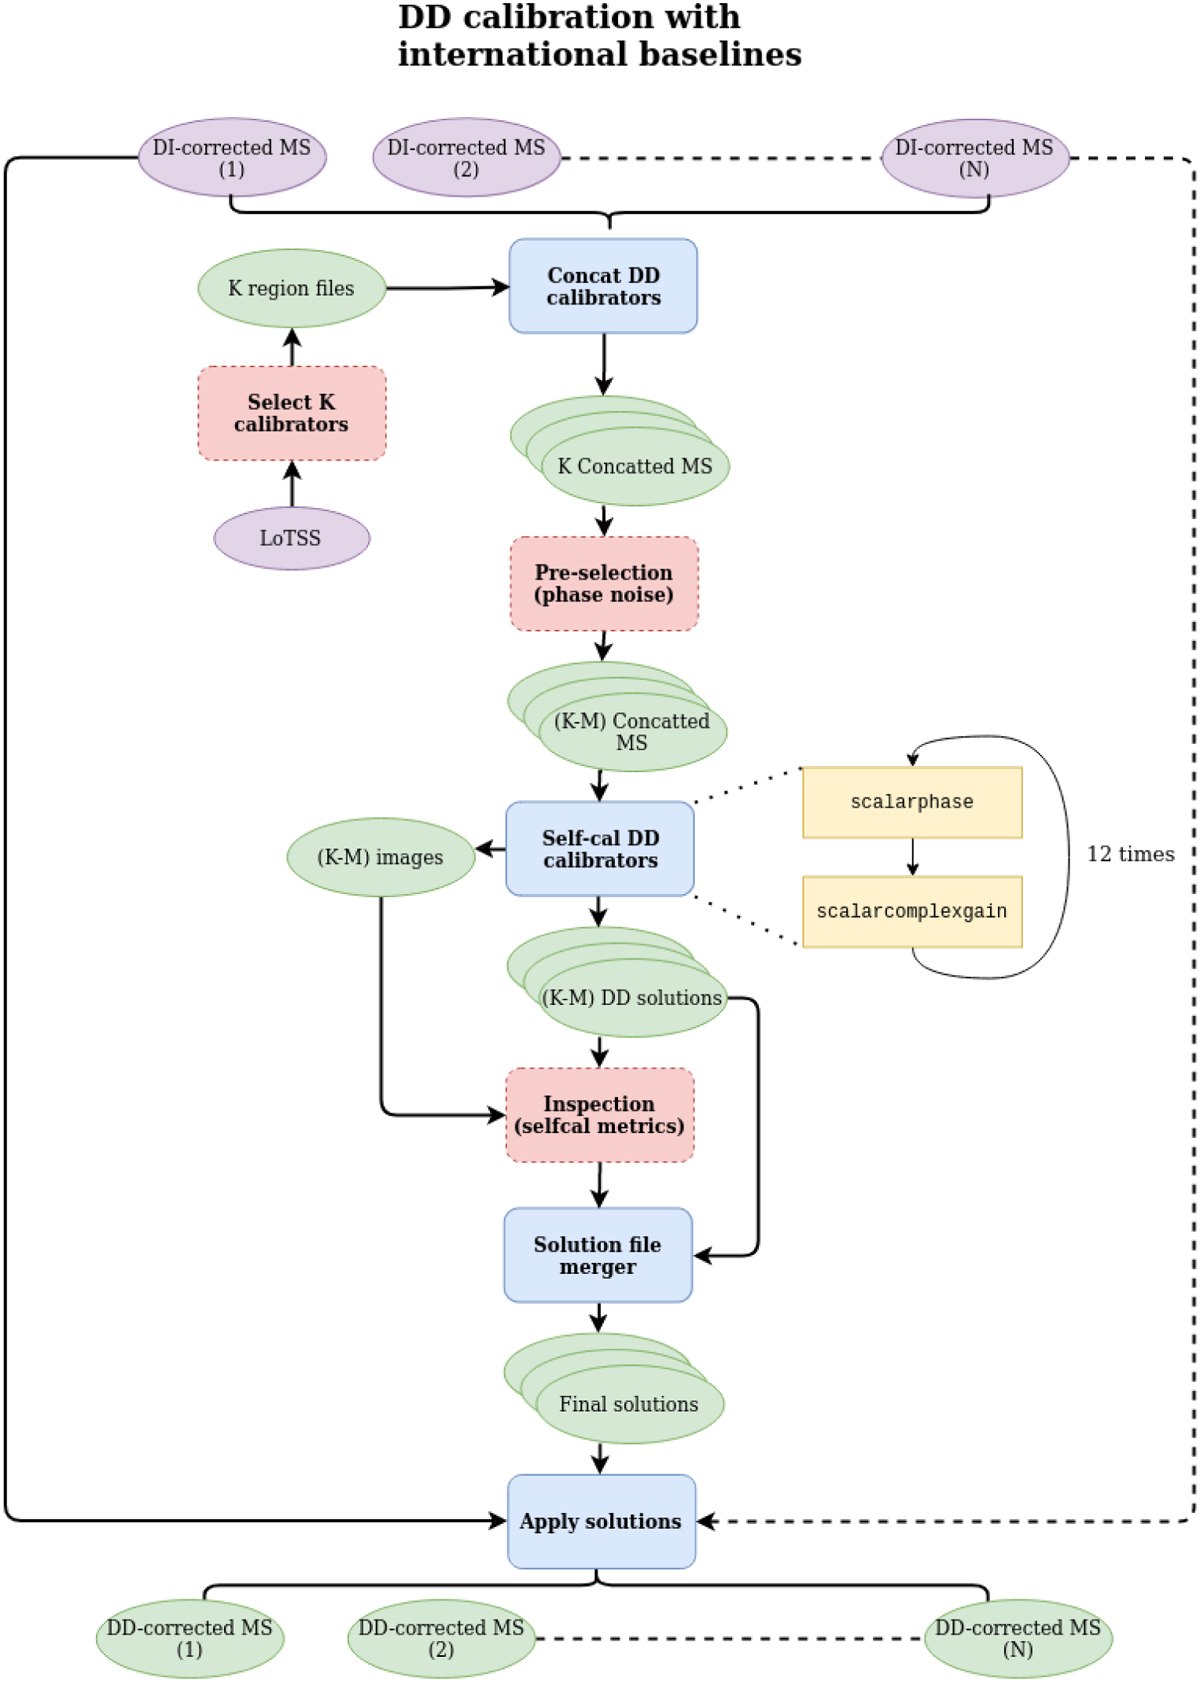
Workflow corresponding to the calibration steps explained in Sec. 3.3 for the general case with N observations. The workflow starts with DI-corrected uv-data and ends with DD-corrected uv-data for N different observations of the same field. These steps follow after the workflow in Fig. 4. In the first source selection, based on the brightest sources from the LoTSS catalogue, we select K sources, after which M of these are filtered out during the phase noise selection metric (see Sect. 3.3.1). This leaves us with (K − M) solutions for each of the N observations. We note that the scalarcomplexgain is only optionally triggered in facetselfcal for brighter sources (See van Weeren et al. 2021). Purple ovals are input data, blue boxes are operations on the data, red boxes are data filters, yellow boxes are calibration steps, and green ovals are output data. Stacked ovals imply that there are output products for each observation. Dashed lines indicate the presence of numerous observations that can run in parallel. For a description of the calibration operations we refer to Table 3.
Current usage metrics show cumulative count of Article Views (full-text article views including HTML views, PDF and ePub downloads, according to the available data) and Abstracts Views on Vision4Press platform.
Data correspond to usage on the plateform after 2015. The current usage metrics is available 48-96 hours after online publication and is updated daily on week days.
Initial download of the metrics may take a while.


