Fig. 29
Download original image
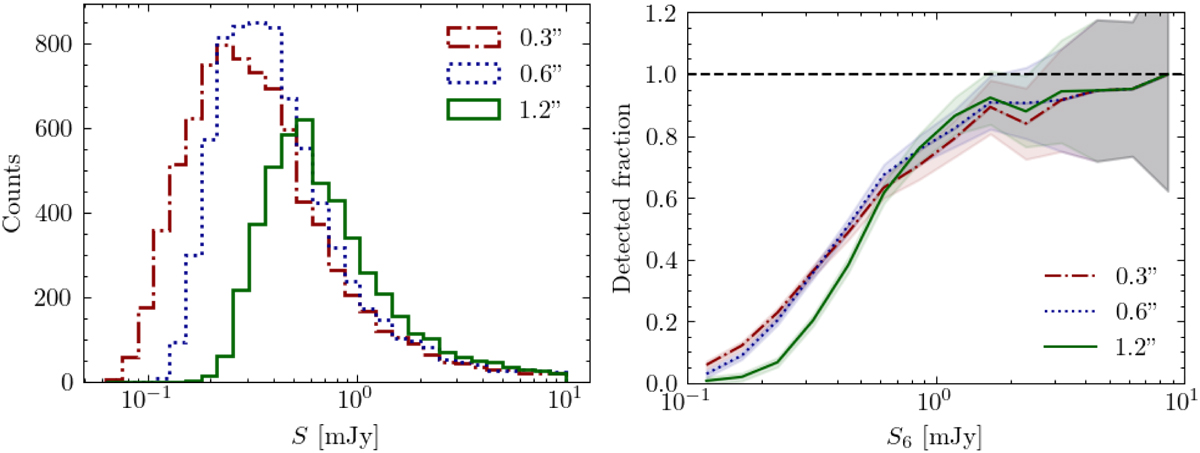
Source detection across resolution. Left panel: source counts as a function of the integrated flux density for our 3 resolutions below 10 mJy. Right panel: detected fraction between sources from our radio maps and the compact sources detected by Shimwell et al. (in prep.) at 6″. For the errors, we propagate Poisson uncertainties.
Current usage metrics show cumulative count of Article Views (full-text article views including HTML views, PDF and ePub downloads, according to the available data) and Abstracts Views on Vision4Press platform.
Data correspond to usage on the plateform after 2015. The current usage metrics is available 48-96 hours after online publication and is updated daily on week days.
Initial download of the metrics may take a while.