Fig. 27

Download original image
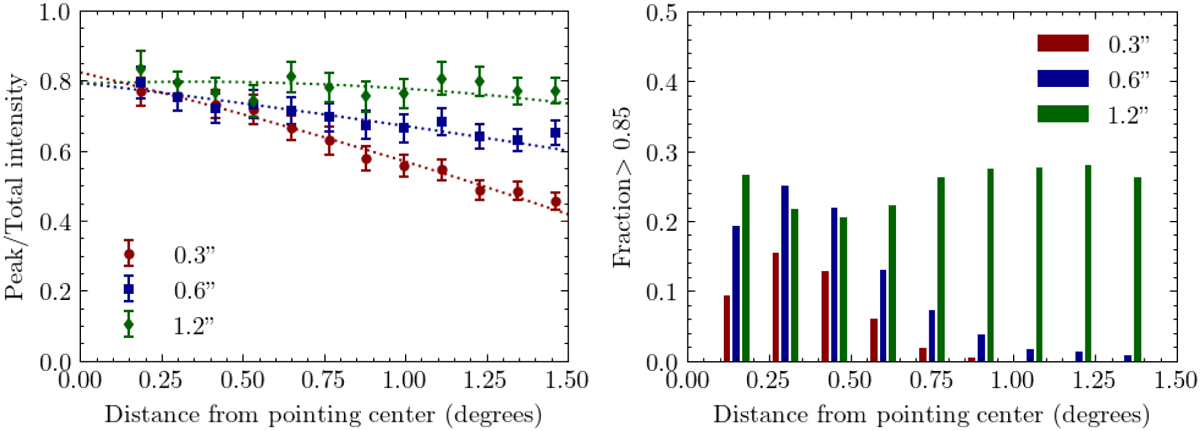
Smearing across distance from the pointing centre. Left panel: ratio of peak over integrated flux density as a function of the distance from the pointing centre for the 3 different resolutions considered in this paper. The plot is made by taking the median ratio for several distance bins. The error bars are based on the errors on the peak and integrated flux densities measured by PyBDSF. Right panel: fraction of sources with peak over integrated flux densities above 0.85 for different distance bins. To enhance the reliability of our source sample, we considered for both panels only sources fitted by a single Gaussian by PyBDSF and a peak intensity at least 15 times above the local RMS noise.
Current usage metrics show cumulative count of Article Views (full-text article views including HTML views, PDF and ePub downloads, according to the available data) and Abstracts Views on Vision4Press platform.
Data correspond to usage on the plateform after 2015. The current usage metrics is available 48-96 hours after online publication and is updated daily on week days.
Initial download of the metrics may take a while.


