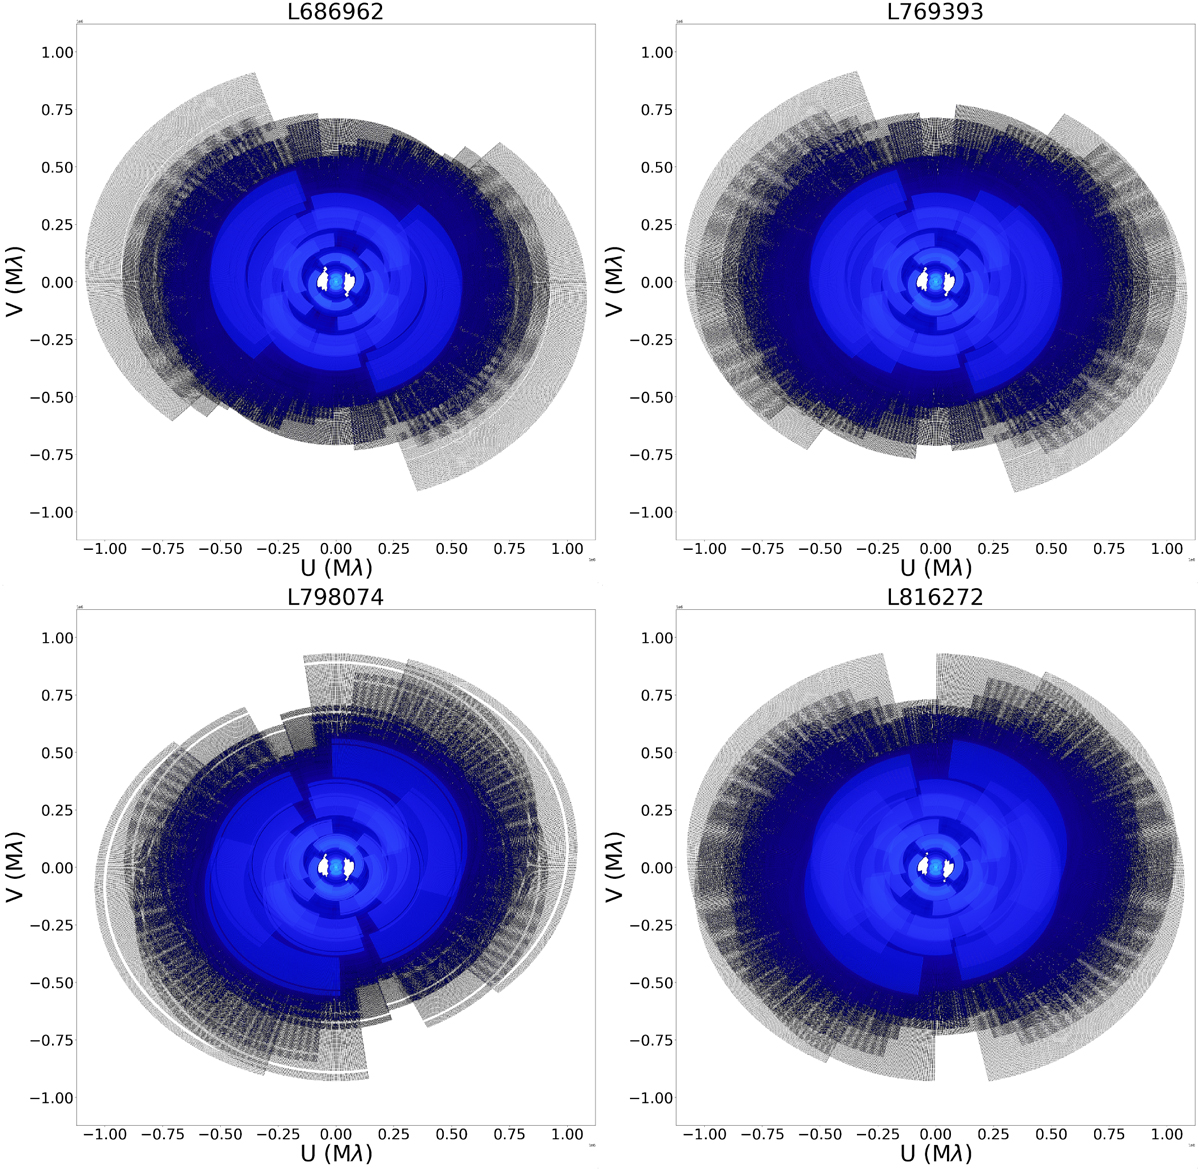
Fig. 2

Download original image
uv-coverage of all four LOFAR observations utilised in this paper. These define the shape of the dirty beam. The uv-coverages in this plot include flagging and are plotted with conjugate uv points. They also include the full frequency bandwidth, which produces the radial extent. These figures are made with the Python library shadems.
Current usage metrics show cumulative count of Article Views (full-text article views including HTML views, PDF and ePub downloads, according to the available data) and Abstracts Views on Vision4Press platform.
Data correspond to usage on the plateform after 2015. The current usage metrics is available 48-96 hours after online publication and is updated daily on week days.
Initial download of the metrics may take a while.


