Fig. 1
Download original image
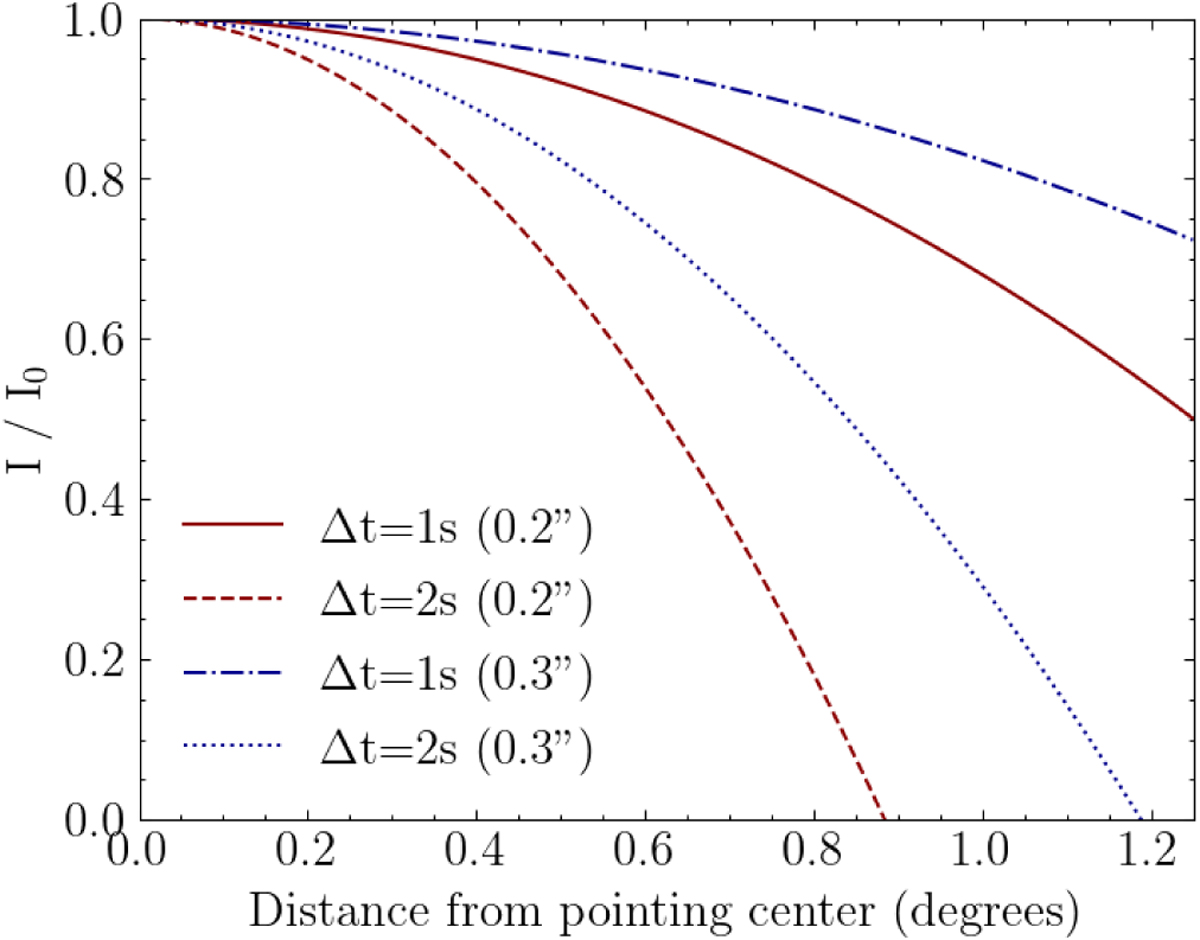
Intensity I as a function of distance from the pointing centre due to a combination of bandwidth and time smearing over the original intensity at the pointing centre I0. We used the smearing formulas according to Bridle & Schwab (1999) with a central frequency of 140 MHz and a bandwidth of 12.21 kHz. This plot includes the smearing from the longest baseline (1980 km) between the LOFAR stations in Birr (Ireland) and Łazy (Poland), reaching a resolution of about 0.2″ (red). We also added I/I0 for our target resolution of 0.3″ (blue), corresponding to a baseline of 1470 km. This figure shows both the smearing for the 1 s and 2 s pre-averaged datasets.
Current usage metrics show cumulative count of Article Views (full-text article views including HTML views, PDF and ePub downloads, according to the available data) and Abstracts Views on Vision4Press platform.
Data correspond to usage on the plateform after 2015. The current usage metrics is available 48-96 hours after online publication and is updated daily on week days.
Initial download of the metrics may take a while.