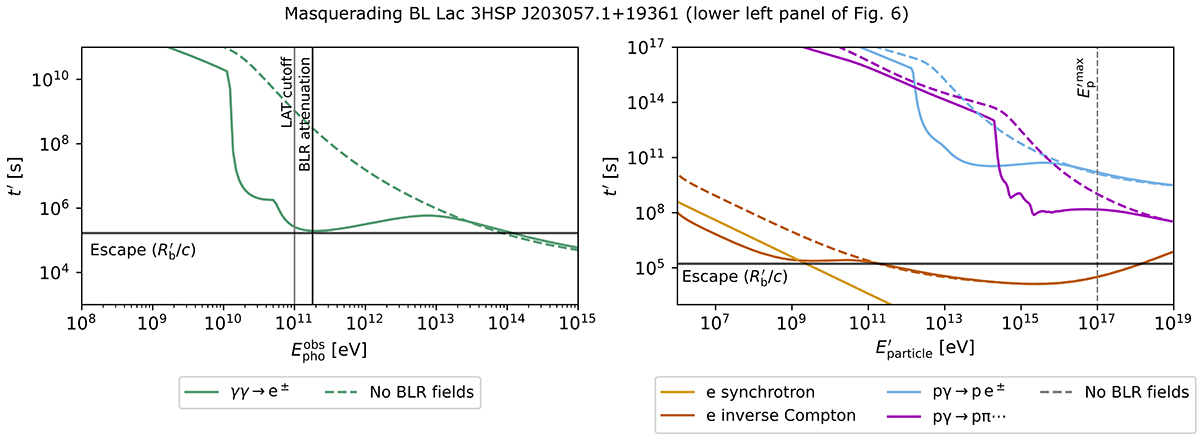
Fig. 6.
Download original image
Interaction timescales of photons (left) and of electrons and protons (right), for one of the masquerading BL Lacs in the sample. The solid curves show the total interaction timescales in the best-fit scenario (cf. Fig. 5). The two peaky features in the magenta curve result from resonant photo-meson interactions between protons and broad line photons, due to the proximity between the dissipation region and the BLR. The dashed curves show how the interaction rates would behave without the presence of external photon fields, as in the case of true BL Lacs.
Current usage metrics show cumulative count of Article Views (full-text article views including HTML views, PDF and ePub downloads, according to the available data) and Abstracts Views on Vision4Press platform.
Data correspond to usage on the plateform after 2015. The current usage metrics is available 48-96 hours after online publication and is updated daily on week days.
Initial download of the metrics may take a while.