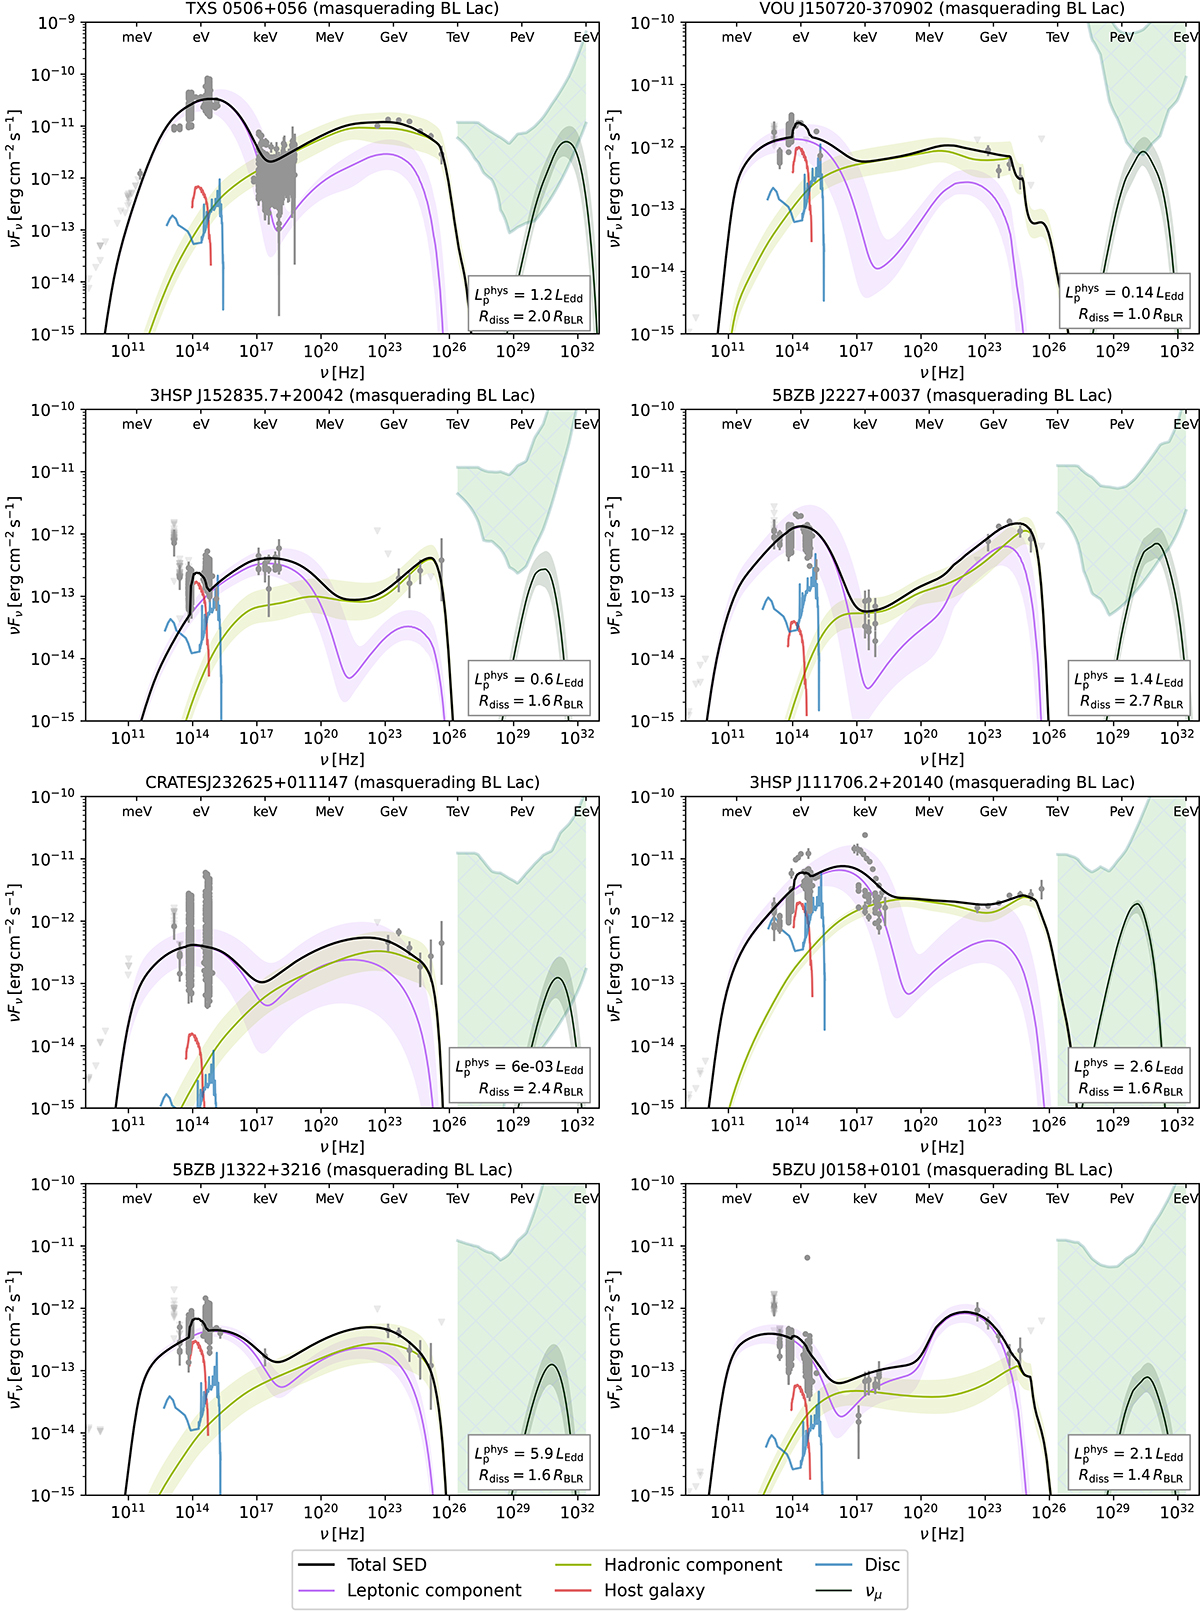
Fig. 5.
Download original image
Multiwavelength and neutrino emission from the G20 blazars previously identified as masquerading BL Lacs. We show the leptonic (purple) and hadronic (light green) components of the jet emission; the corresponding neutrino emission is shown in dark green. The error bands show the 1σ uncertainty range. In red is the host contribution, and in blue the spectrum from the accretion disk, broad lines, and dust torus (cf. Fig. 2). The green region represents the allowed energies and fluxes of the peak of the neutrino spectrum so as to satisfy the IceCube limits at the 68% confidence level (cf. Section 2.7 and Appendix A).
Current usage metrics show cumulative count of Article Views (full-text article views including HTML views, PDF and ePub downloads, according to the available data) and Abstracts Views on Vision4Press platform.
Data correspond to usage on the plateform after 2015. The current usage metrics is available 48-96 hours after online publication and is updated daily on week days.
Initial download of the metrics may take a while.