Fig. 4.
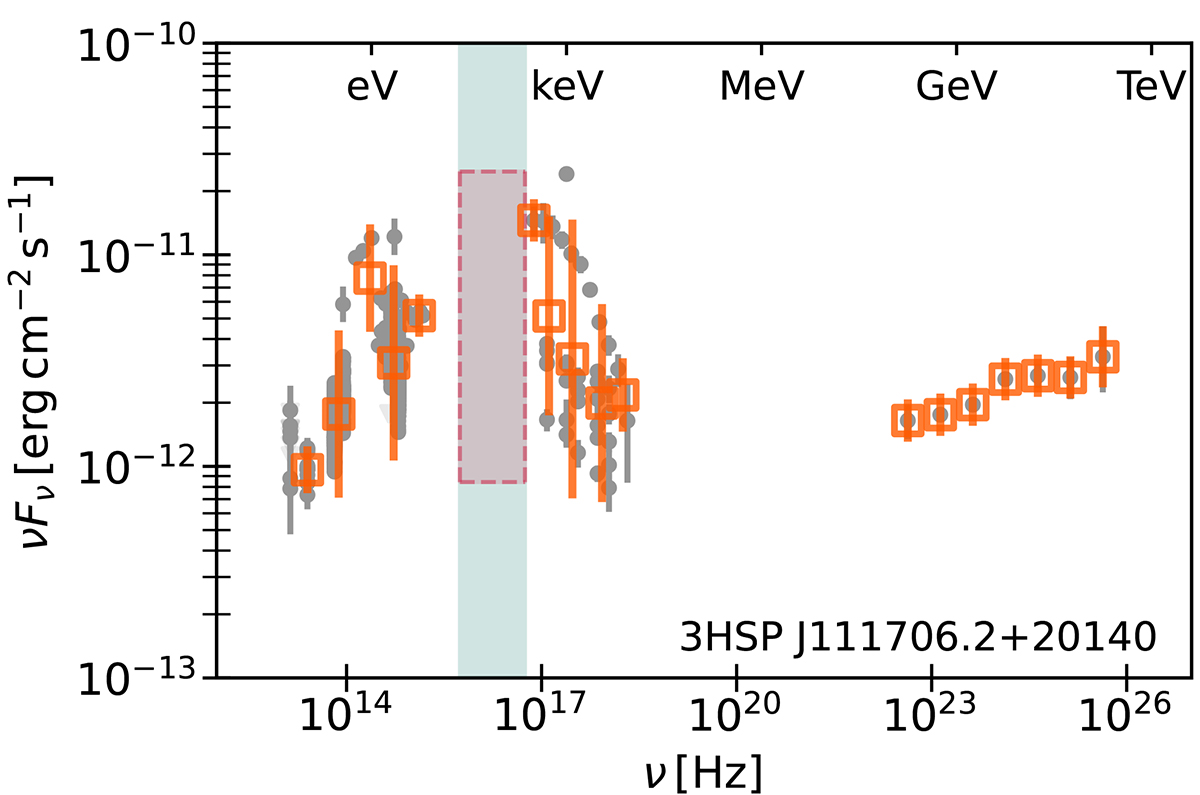
Download original image
Result of the binning procedure for one source in the sample, used as input for the model optimization. As gray data points we show the observations compiled in Paper IV; the upper limits are shown as downward triangles. The orange squares represent the binned fluxes while the orange error bars show the uncertainty in each binned flux. This uncertainty reflects both the intrinsic uncertainty in the data as well as the spread in the flux measurements within the same frequency bin. The red rectangle represents the area of acceptable synchrotron peaks based on the data, following the procedure described in Section 2.3.
Current usage metrics show cumulative count of Article Views (full-text article views including HTML views, PDF and ePub downloads, according to the available data) and Abstracts Views on Vision4Press platform.
Data correspond to usage on the plateform after 2015. The current usage metrics is available 48-96 hours after online publication and is updated daily on week days.
Initial download of the metrics may take a while.