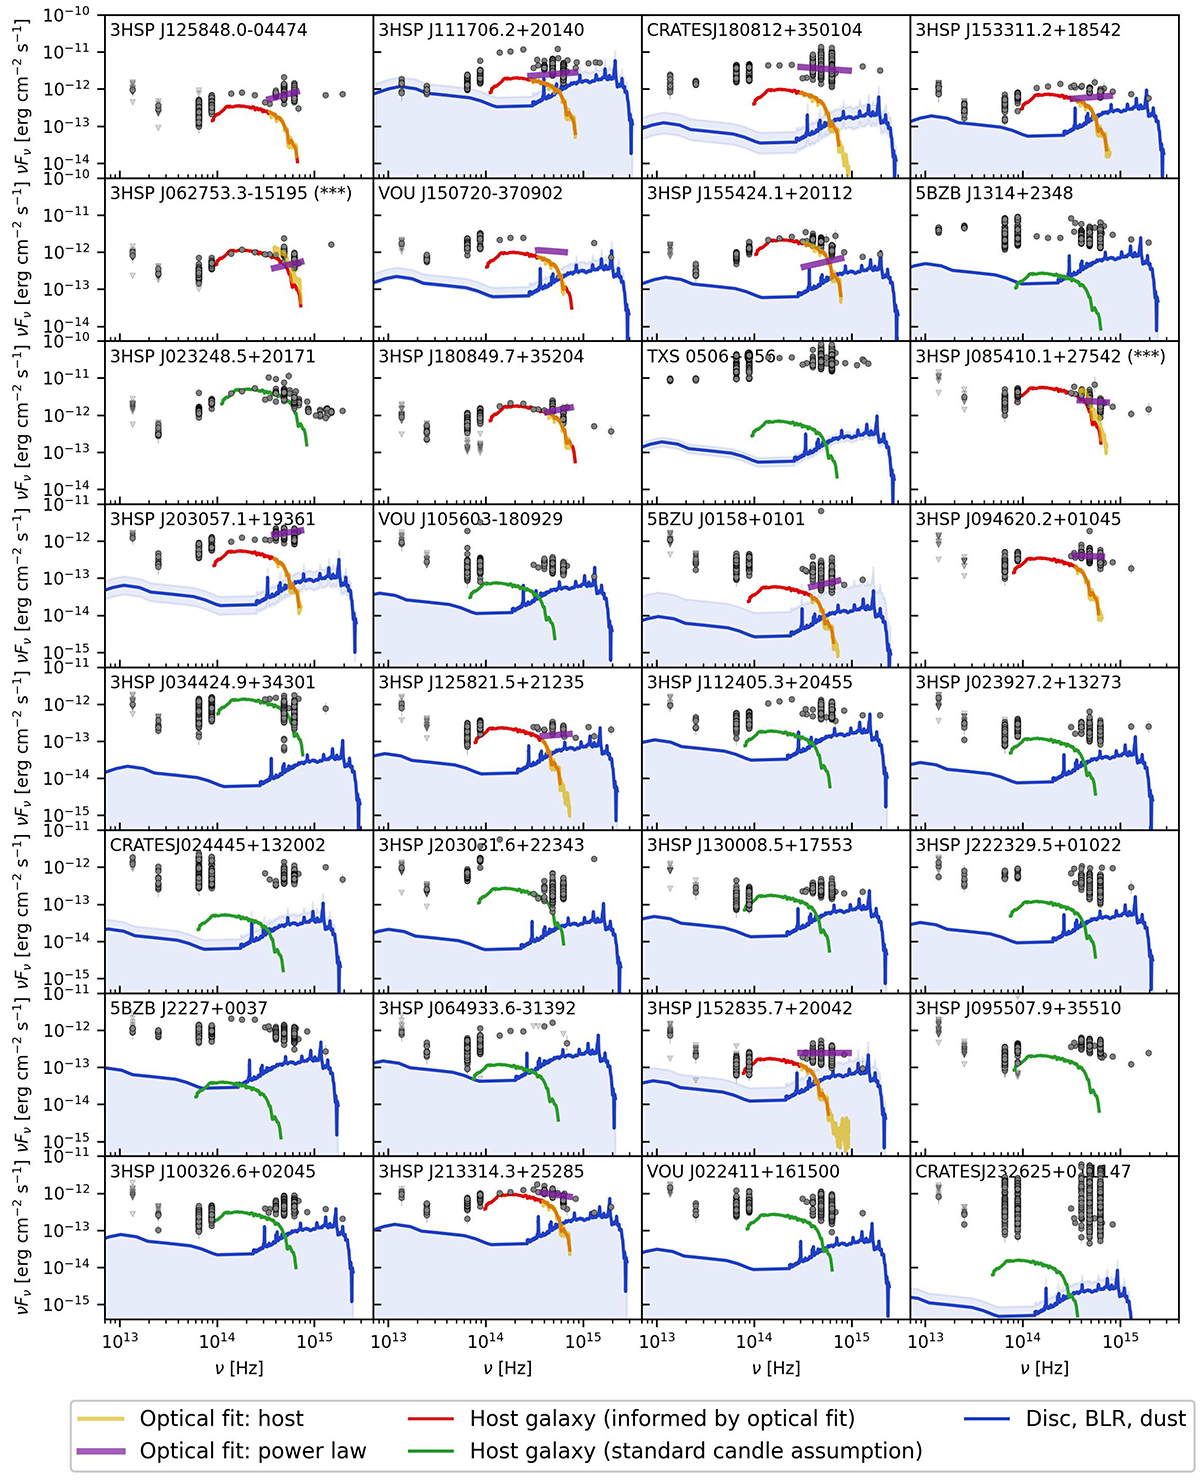
Fig. C.1.
Download original image
Results of the fitting of the host galaxy contribution for all sources in the sample. In all these cases, the host contribution was constrained based on optical spectroscopy, as reported in Paper III. The gray points show the broadband SED; the blue curve and the respective error band show the template spectrum for the disk, BLR, and dust torus emission, normalized to match the disk luminosity value; the red curve shows the fit to the host spectrum resulting from the spectral decomposition, and the purple line the power-law component.
Current usage metrics show cumulative count of Article Views (full-text article views including HTML views, PDF and ePub downloads, according to the available data) and Abstracts Views on Vision4Press platform.
Data correspond to usage on the plateform after 2015. The current usage metrics is available 48-96 hours after online publication and is updated daily on week days.
Initial download of the metrics may take a while.