Fig. A.3.
Download original image
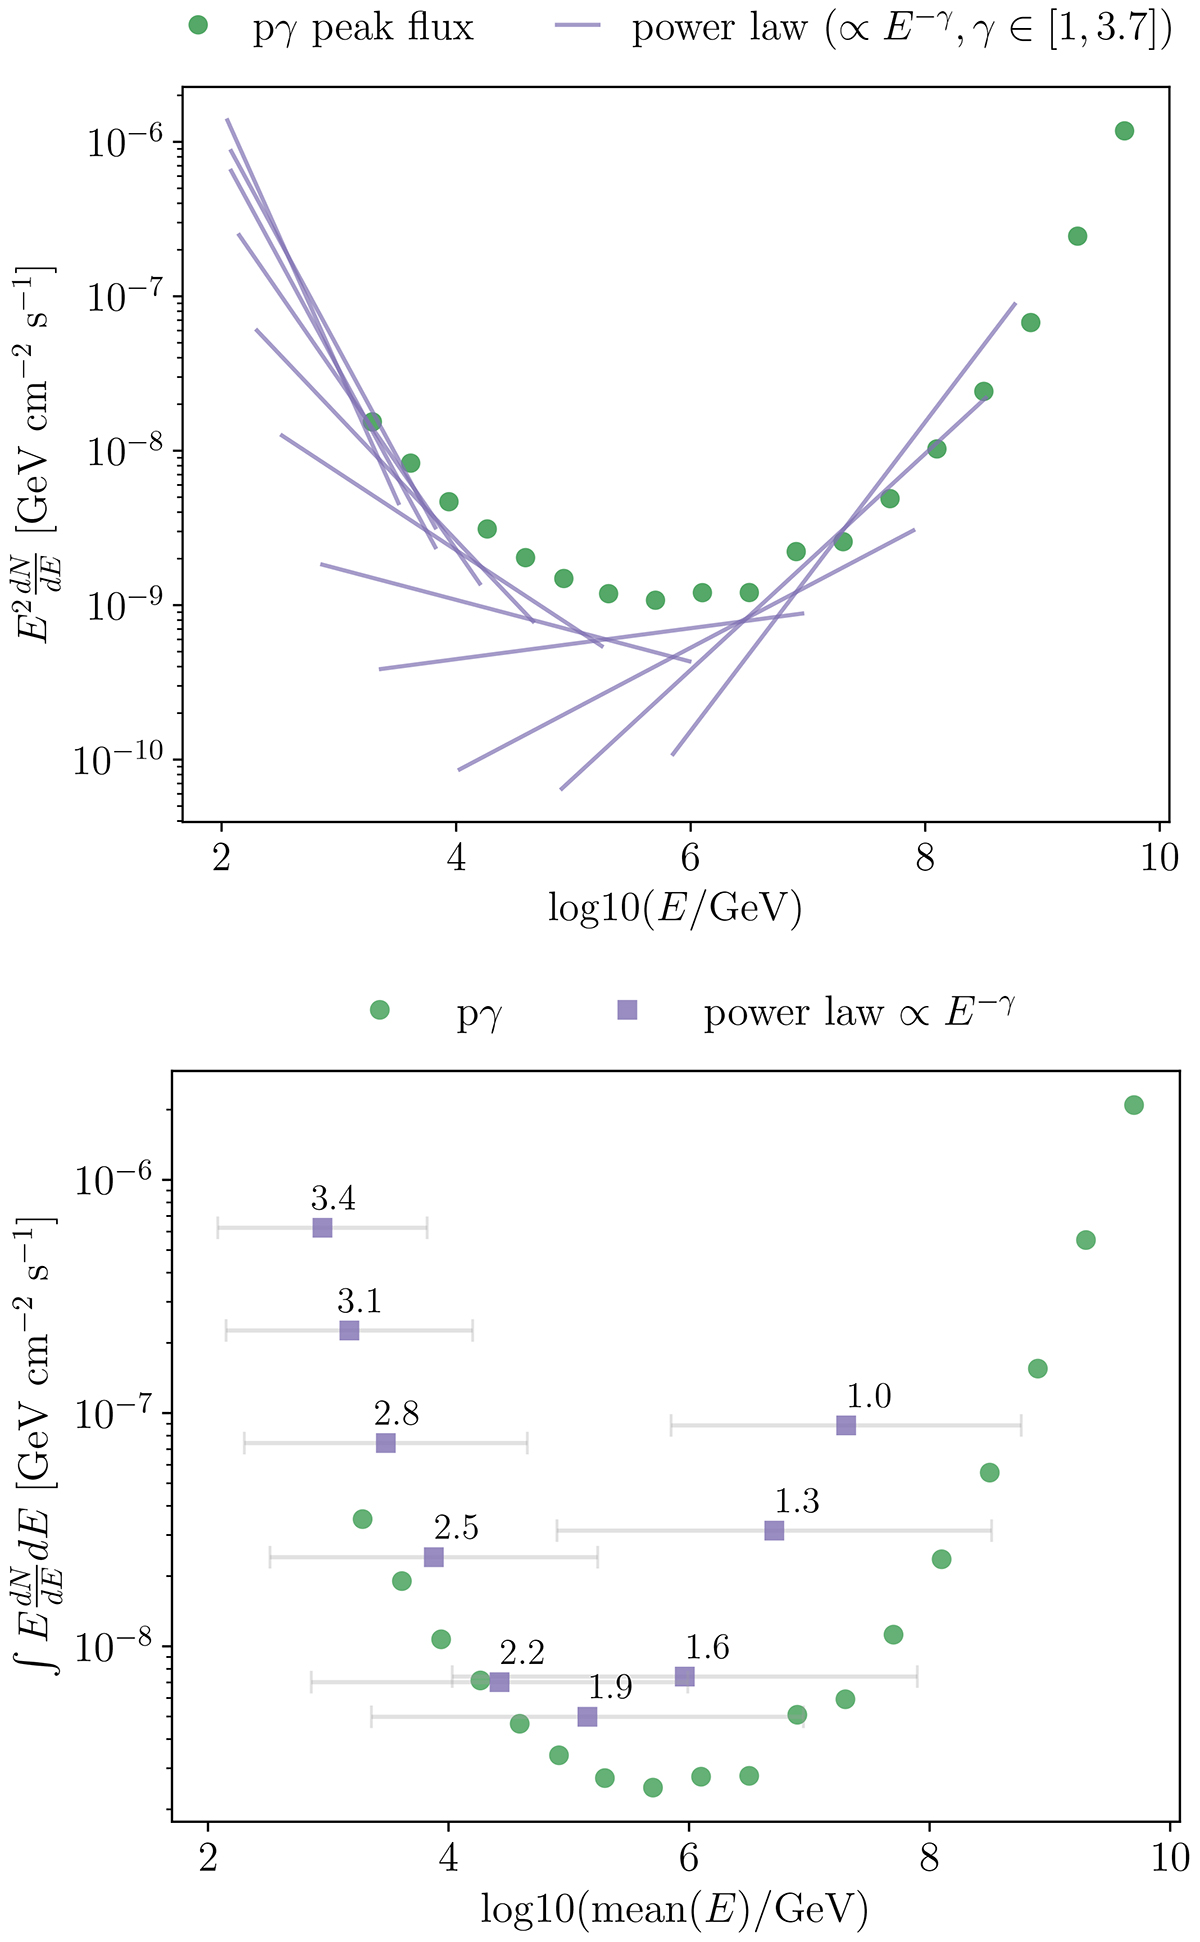
3σ neutrino discovery potential at the location of TXS 0506+056, assuming the source emits a power-law spectrum (purple) and a pγ-like spectrum (green). The 3σ discovery potential is the flux a source would need to emit to have a 50% probability of being detected with 3σ significance. Top: The purple lines show the differential discovery potential for different power-law spectra with spectral indices between 1 and 3.7. Each spectrum is shown extending across the corresponding valid energy range, estimated following the procedure described in the text. The green points show the peak position of the 3σ discovery potential fluxes assuming a pγ-like spectrum (upper panel of Fig. A.1) with different Epeak values. Bottom: The integrated 3σ discovery potential fluxes for the different spectra. The purple squares show the integrated power-law fluxes and the gray bars indicate the energy integration range. The numbers state the respective spectral index, γ, of the power law. The green dots show the integrated fluxes from 100 GeV to 10 EeV for the full pγ spectra at their respective Epeak.
Current usage metrics show cumulative count of Article Views (full-text article views including HTML views, PDF and ePub downloads, according to the available data) and Abstracts Views on Vision4Press platform.
Data correspond to usage on the plateform after 2015. The current usage metrics is available 48-96 hours after online publication and is updated daily on week days.
Initial download of the metrics may take a while.