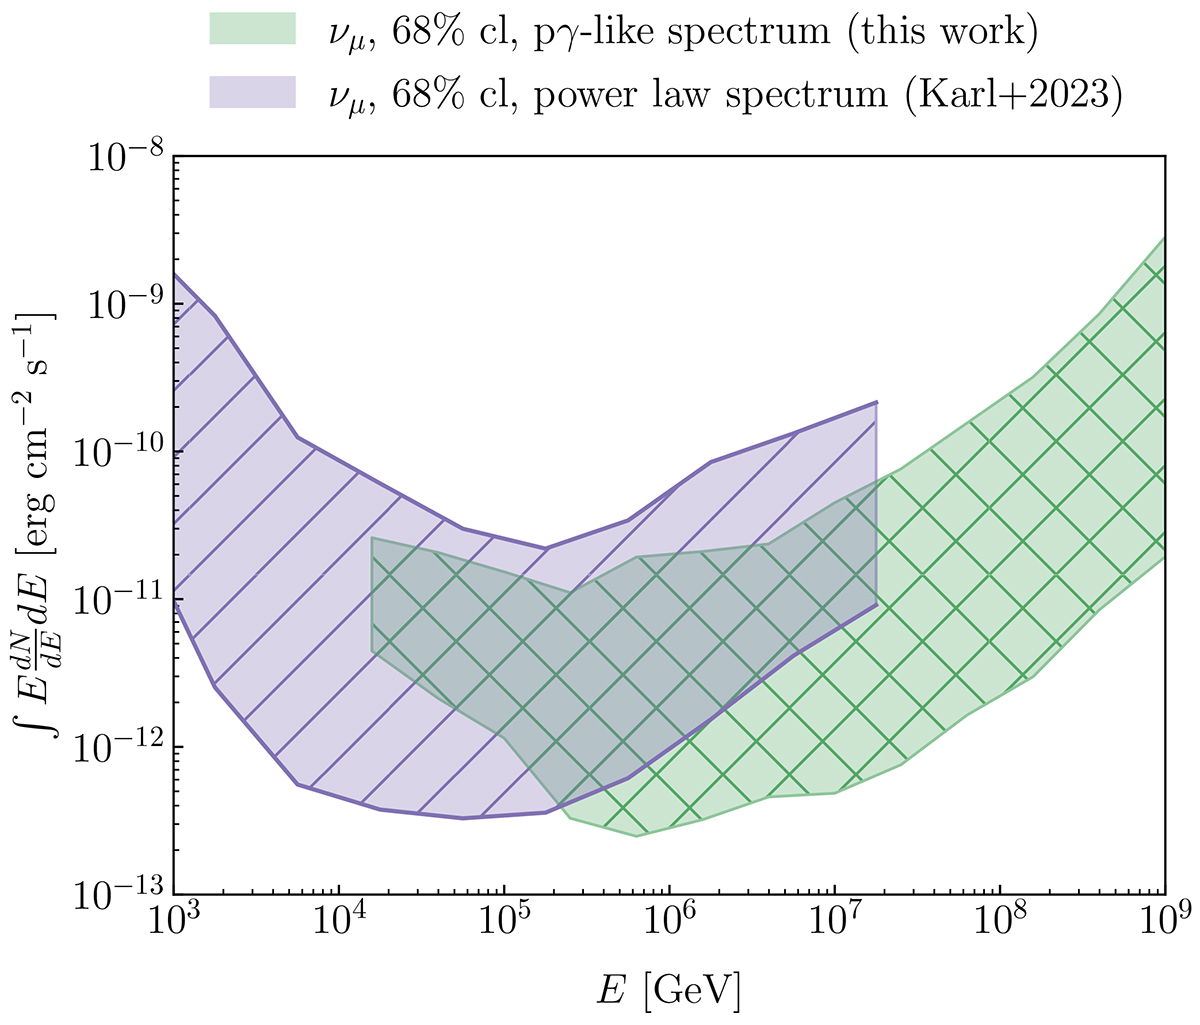
Fig. A.2.
Download original image
Integrated fluxes of the 68% confidence limit bands as shown in Fig. A.1 for the power-law assumption (purple diagonally hatched) and the pγ spectrum (green cross-hatched), for source TXS 0506+056. For the pγ spectrum, the flux is shown as a function of the peak energy. For the power-law spectrum, the flux is shown at the respective mean energy (cf. lower panel of Fig. A.3). This is the reason why the purple band covers a more limited energy range than in the lower panel of Fig. A.1, where the differential flux is shown in the full energy range of the analysis.
Current usage metrics show cumulative count of Article Views (full-text article views including HTML views, PDF and ePub downloads, according to the available data) and Abstracts Views on Vision4Press platform.
Data correspond to usage on the plateform after 2015. The current usage metrics is available 48-96 hours after online publication and is updated daily on week days.
Initial download of the metrics may take a while.