Fig. A.1.
Download original image
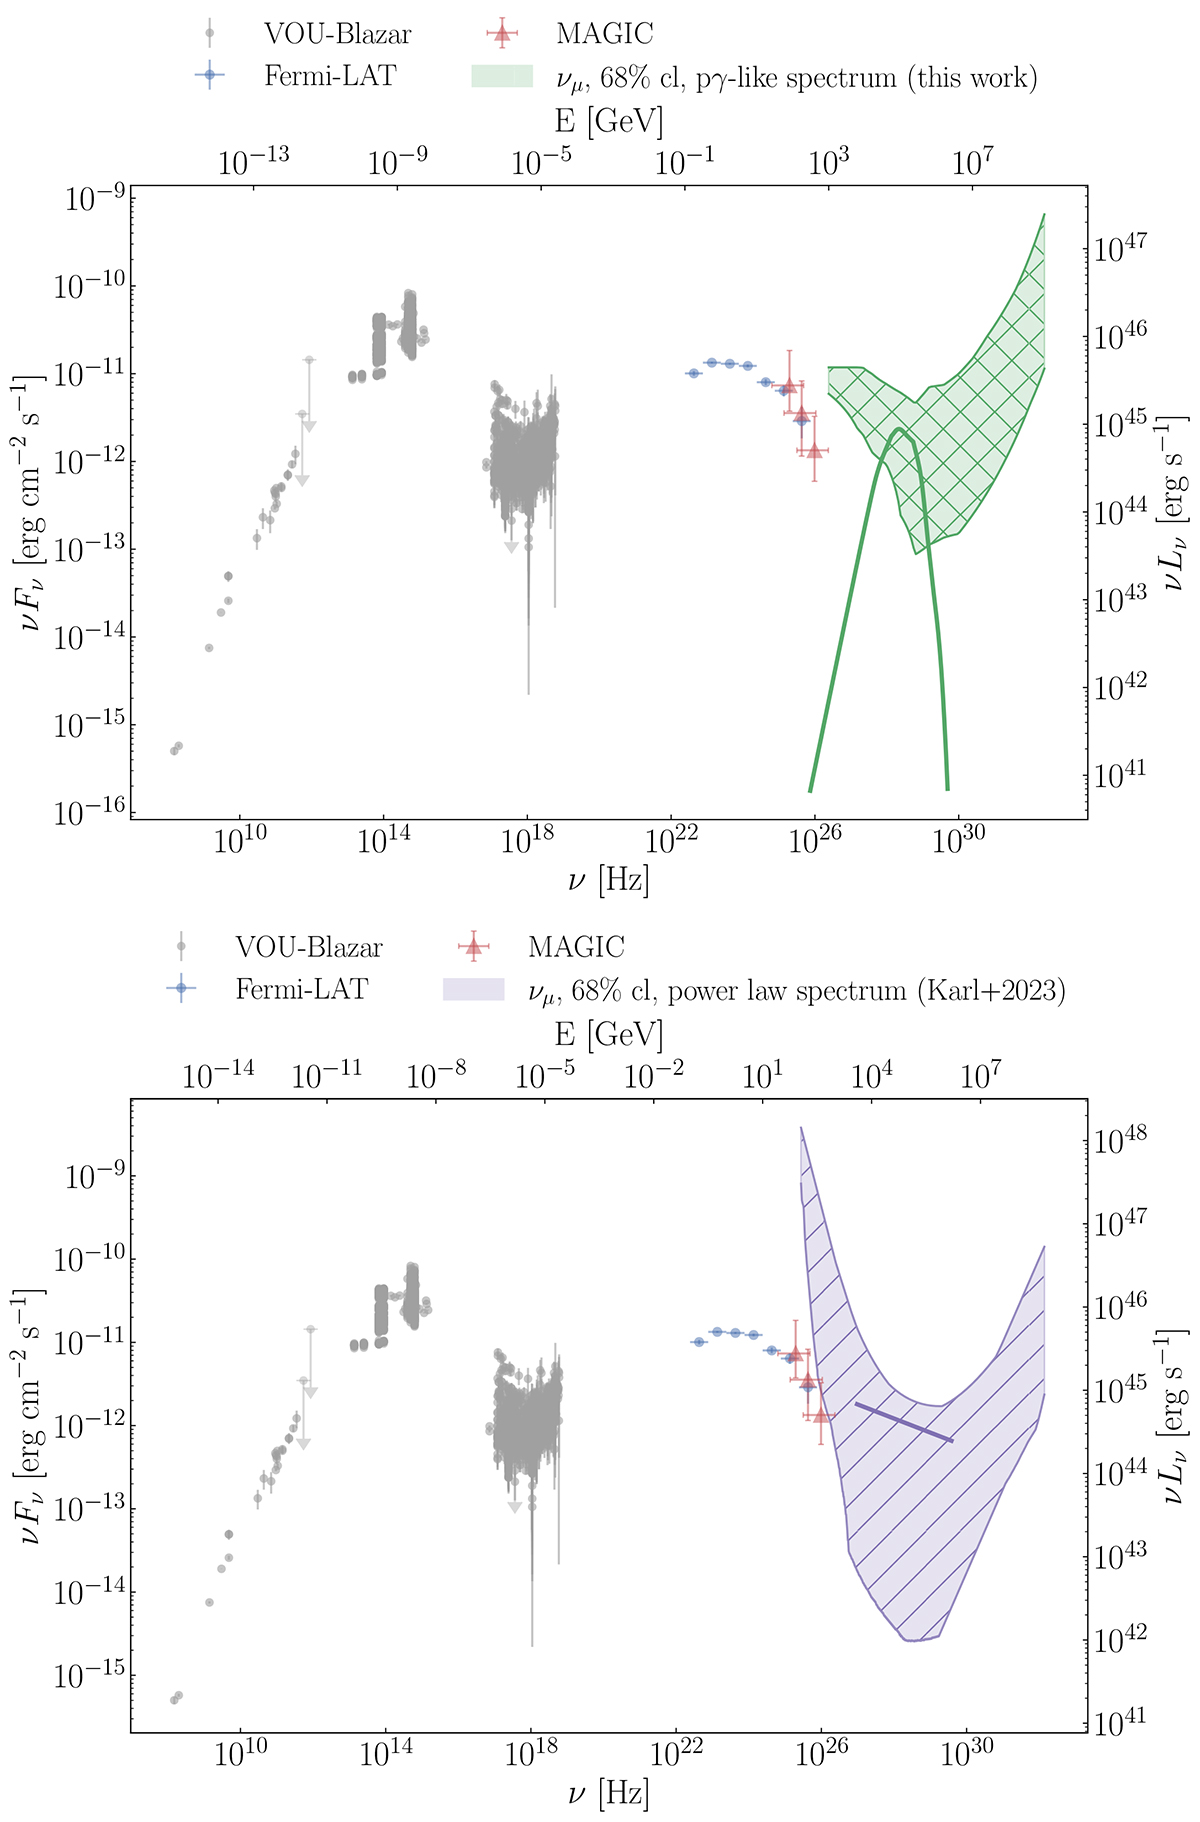
multimesssenger fluxes from TXS 0506+056. The gray, blue, and red data points show the multiwavelength flux observations, according to the legend shown above. The colored bands show the range of the best-fit point source neutrino flux at the 68% confidence level, derived from public IceCube data, assuming two different signal spectral shapes. Top: The signal spectrum is assumed to be peaky, as predicted by leptohadronic blazar models; the template shape considered for all sources is shown as a green curve. The green band shows the allowed peak positions at the 68% confidence level. These are the data used in this work to constrain the model. Bottom: The signal spectrum is assumed to be a power law, as exemplified by the purple line. The purple band shows the point source neutrino fluxes from this blazar compatible with the data at the 68% confidence level. This was the analysis performed in Paper IV.
Current usage metrics show cumulative count of Article Views (full-text article views including HTML views, PDF and ePub downloads, according to the available data) and Abstracts Views on Vision4Press platform.
Data correspond to usage on the plateform after 2015. The current usage metrics is available 48-96 hours after online publication and is updated daily on week days.
Initial download of the metrics may take a while.