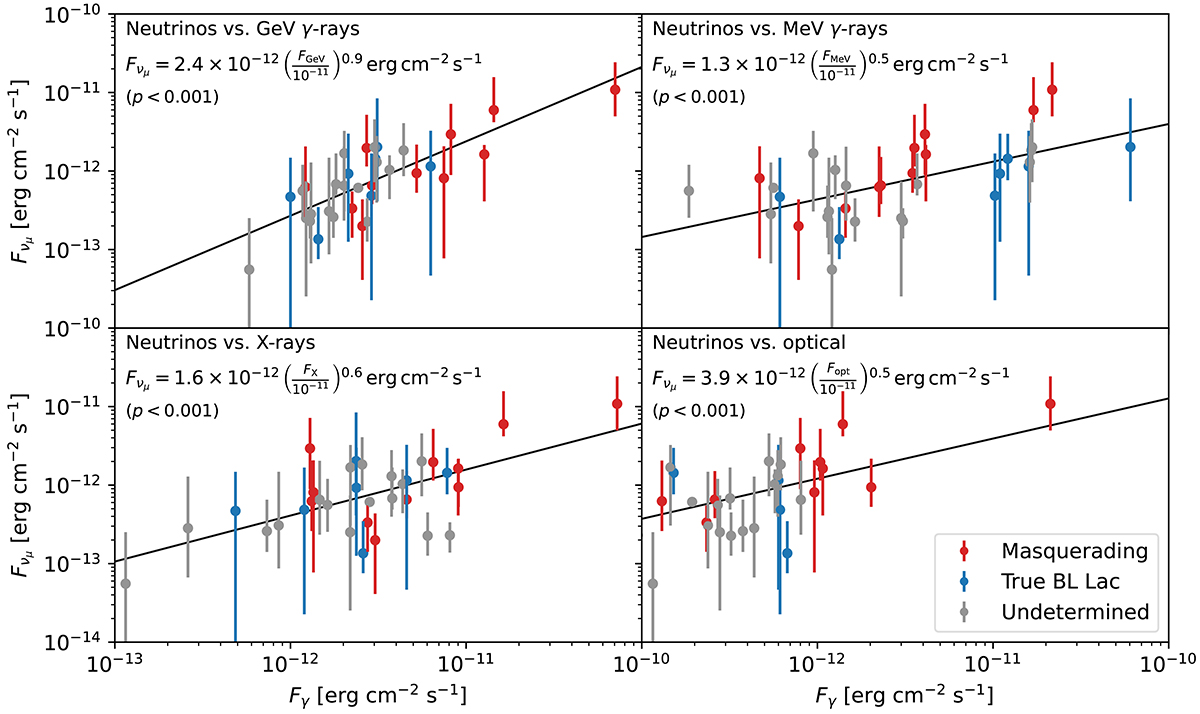
Fig. 9.
Download original image
Empirical relations between the neutrino and photon fluxes derived from the model results. We show the total predicted muon neutrino flux from each source in the sample, plotted against the total photon flux in the range 0.1–100 GeV (upper left), 0.1–10 MeV (upper right), 0.1–100 keV (lower left), and in the optical range, 380–750 nm (lower right). The best-fit power-law relations are shown as black lines, and the corresponding relations are given in the upper right. Below, we report the p-value of the corresponding Pearson correlation test.
Current usage metrics show cumulative count of Article Views (full-text article views including HTML views, PDF and ePub downloads, according to the available data) and Abstracts Views on Vision4Press platform.
Data correspond to usage on the plateform after 2015. The current usage metrics is available 48-96 hours after online publication and is updated daily on week days.
Initial download of the metrics may take a while.