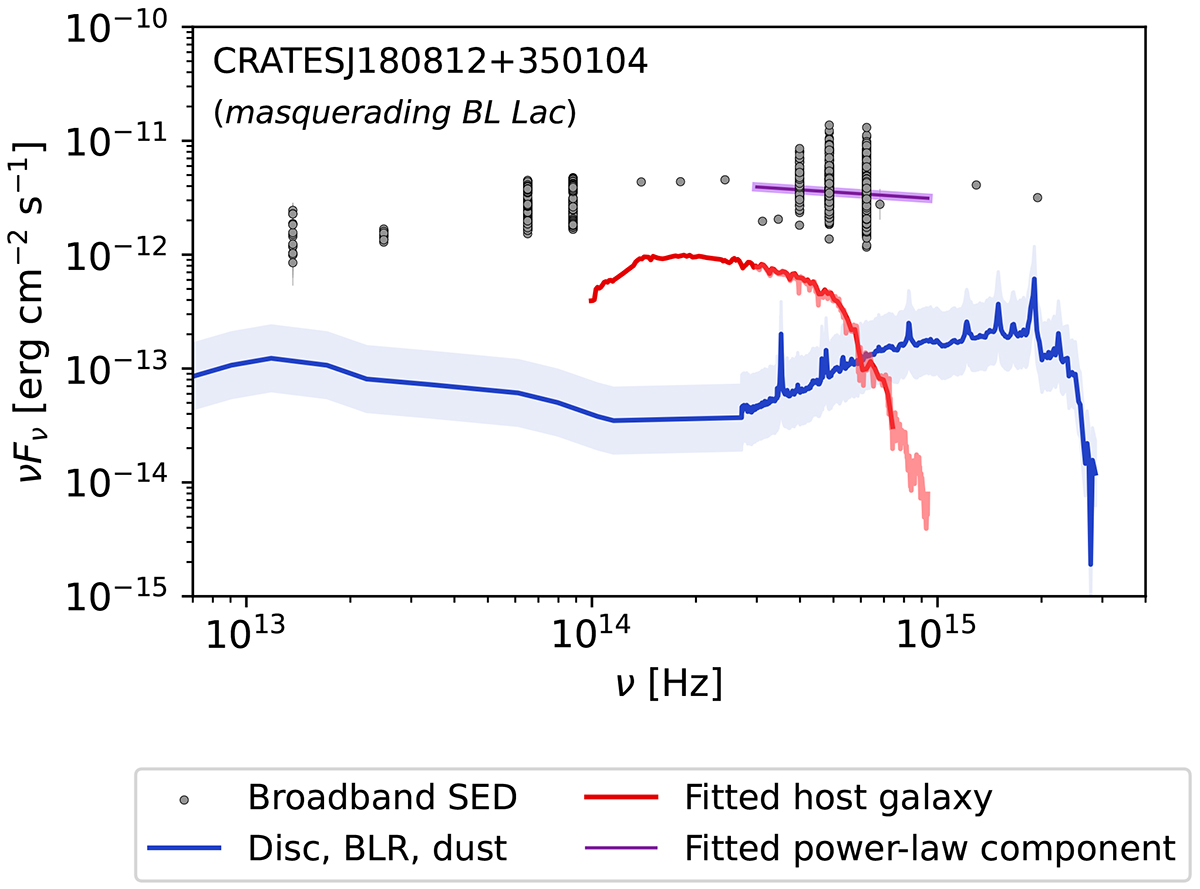
Fig. 1.
Download original image
Infrared and optical spectrum of a masquerading BL Lac from the sample, given in the observer’s frame. The gray points represent the broadband SED data (Paper IV). In red and purple, we show the result of the spectral decomposition following the optical spectroscopy campaign of the G20 sample (Paper III). In blue we show the template spectrum adapted from (Vanden Berk et al. 2001) and the respective error range, which comes from the uncertainty on the disk luminosity (cf. Fig. 2). At lower frequencies we see the infrared emission from a dust torus, and toward higher frequencies a thermal continuum from the accretion disk and broad lines from the BLR. Each of these three components is seen with a different relativistic boost in the rest frame of the relativistic jet, as explained in Section 2.1 and Appendix D.
Current usage metrics show cumulative count of Article Views (full-text article views including HTML views, PDF and ePub downloads, according to the available data) and Abstracts Views on Vision4Press platform.
Data correspond to usage on the plateform after 2015. The current usage metrics is available 48-96 hours after online publication and is updated daily on week days.
Initial download of the metrics may take a while.