Fig. 3
Download original image
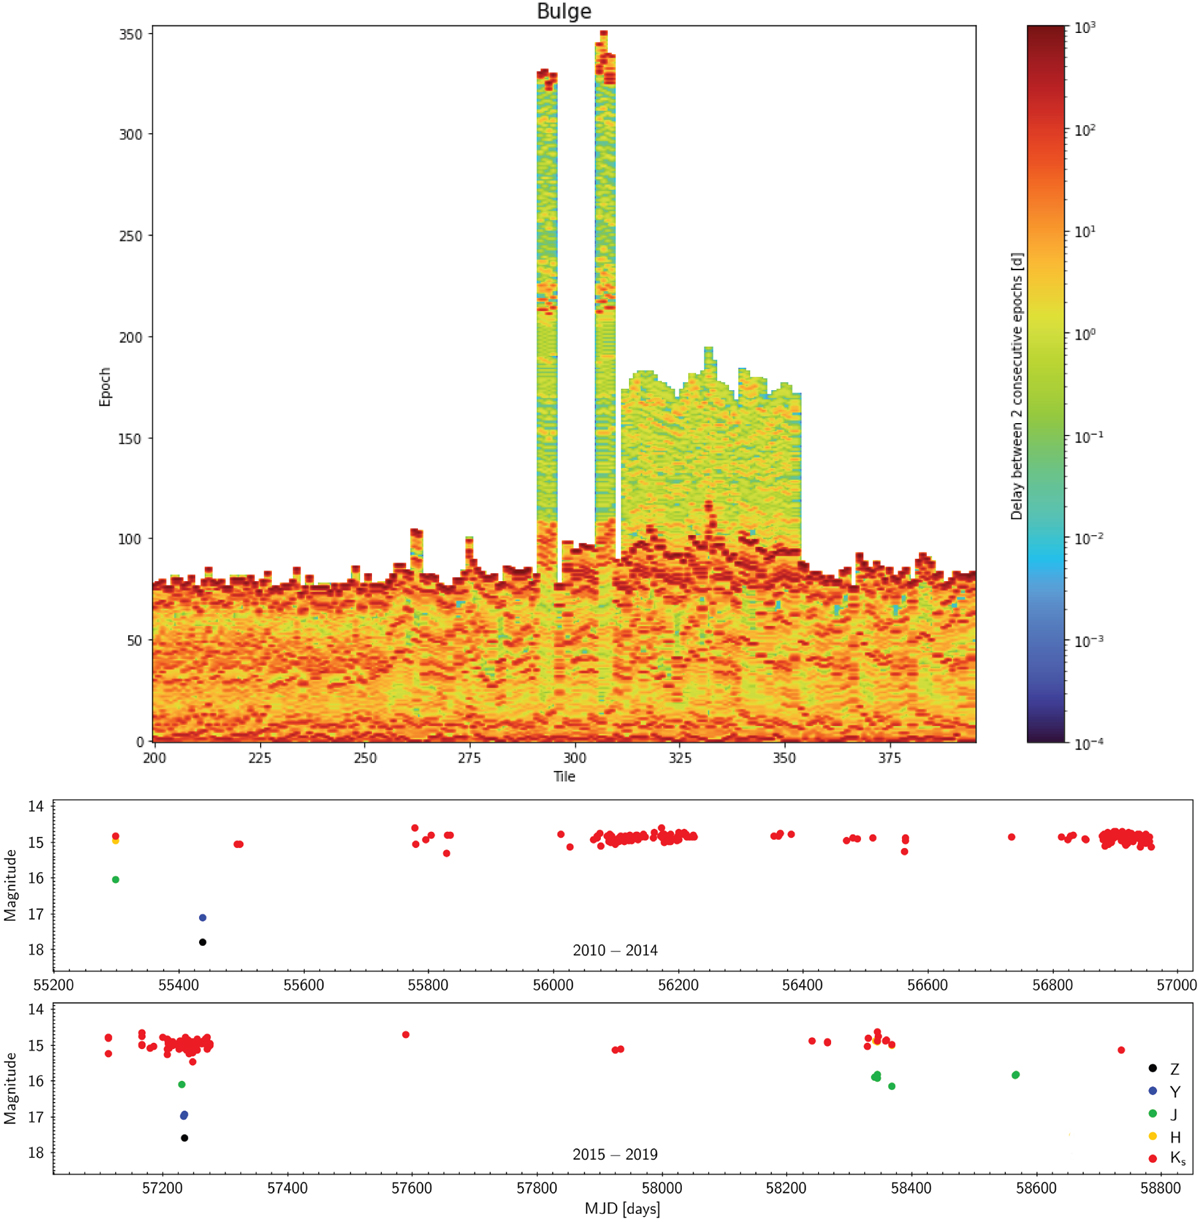
Cadence of the VVV+VVVX bulge observations. Top: density plot showing the cadence of the bulge observations in both VVV and VVVX campaigns. Bottom: light curve example for the source VVV-VIVACE ID 533558 (Ks − 14.9 mag; Molnar et al. 2022), observed by VVV+VVVX in the five VISTA broad band filters in the bulge field b307. There are a total of 363 observations in the five filters along years 2010 to 2019. The coordinates for the target are RA, Dec (J2000) = 18:00:11.48, −28:25:13 (corresponding to l, b = 2.0688, −2.4904 deg.).
Current usage metrics show cumulative count of Article Views (full-text article views including HTML views, PDF and ePub downloads, according to the available data) and Abstracts Views on Vision4Press platform.
Data correspond to usage on the plateform after 2015. The current usage metrics is available 48-96 hours after online publication and is updated daily on week days.
Initial download of the metrics may take a while.