Fig. 2
Download original image
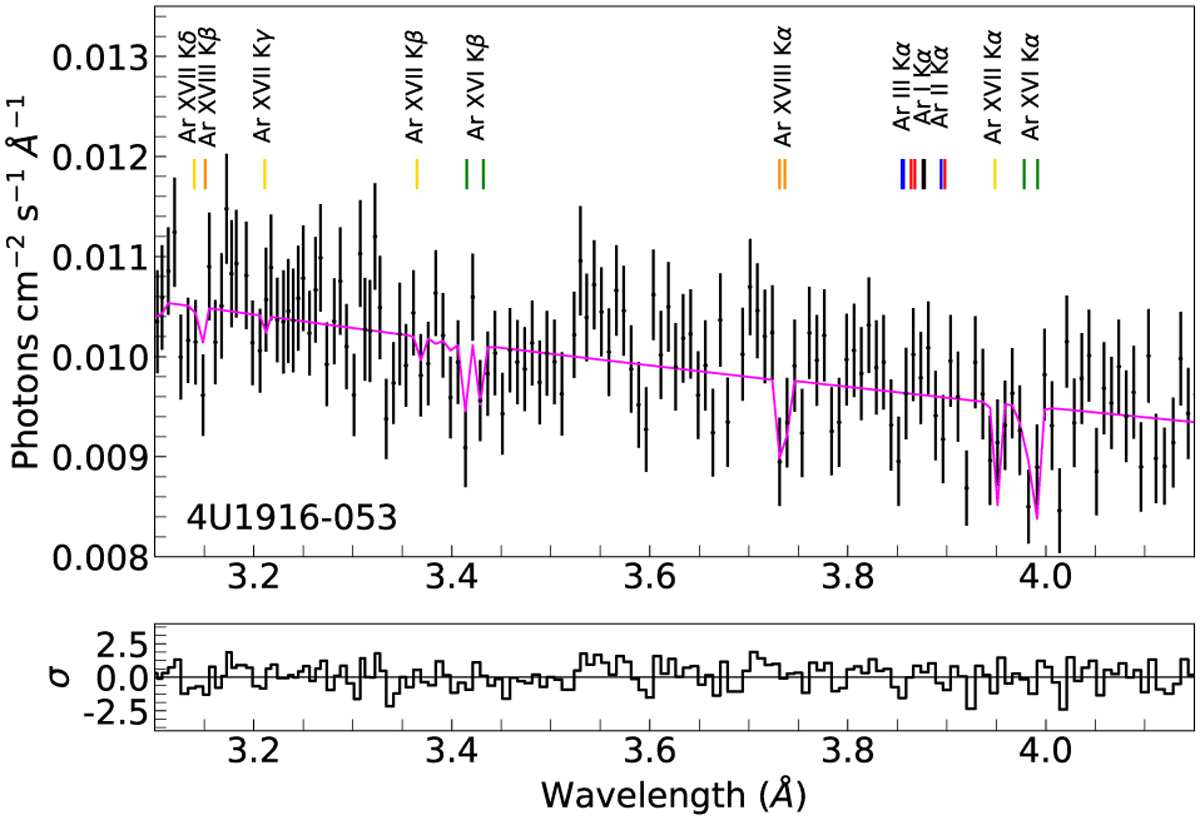
Best-fit results in the Ar K-edge photoabsorption region for the LMXB 4U 1916-053. Black points correspond to the observation in flux units, while the red line corresponds to the best-fit model. Residuals are included in units of (data − model)/error. The position of the Kα absorption lines are indicated for each ion, following the color code used in Fig. 1.
Current usage metrics show cumulative count of Article Views (full-text article views including HTML views, PDF and ePub downloads, according to the available data) and Abstracts Views on Vision4Press platform.
Data correspond to usage on the plateform after 2015. The current usage metrics is available 48-96 hours after online publication and is updated daily on week days.
Initial download of the metrics may take a while.