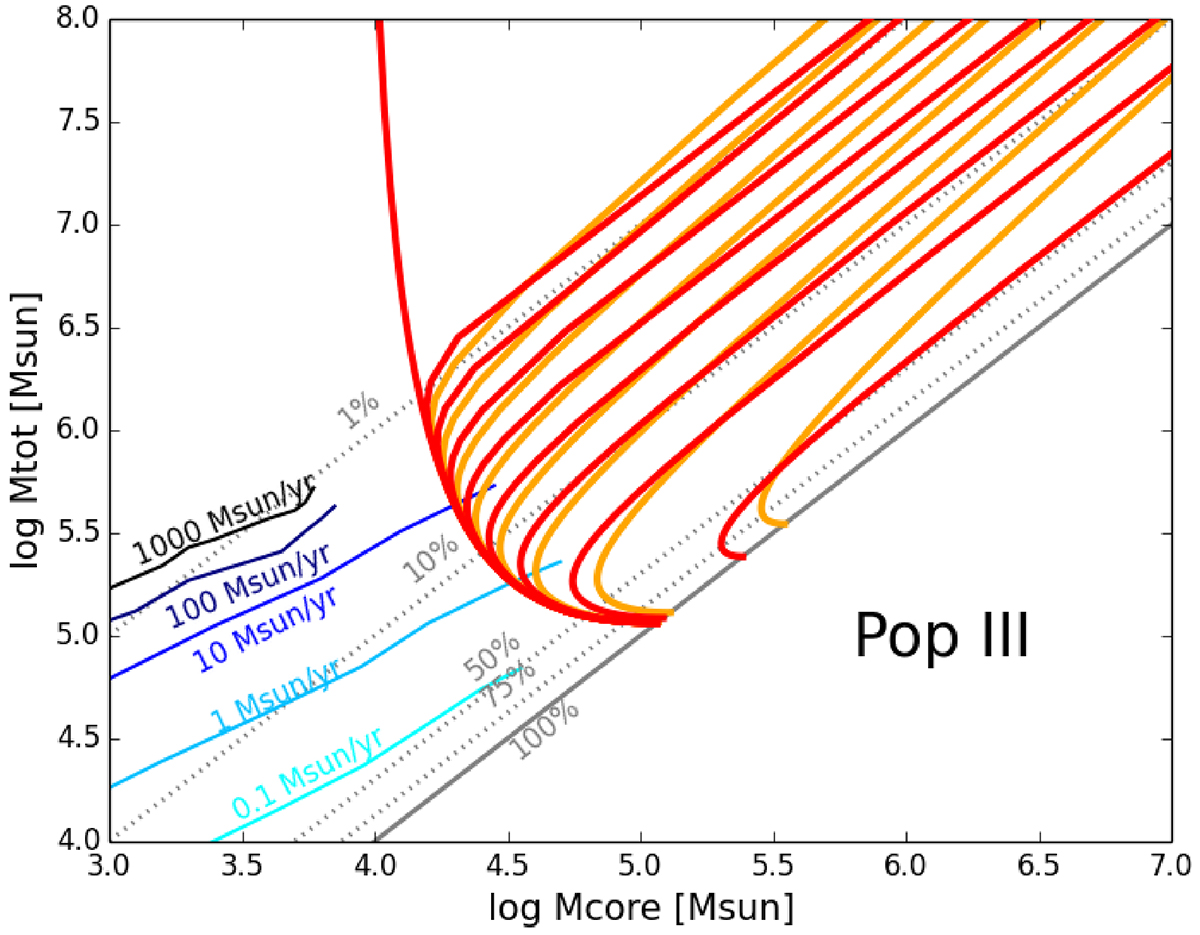
Fig. 2.
Download original image
Limits of dynamical stability in the (Mcore, M) diagram for Pop III hylotropic SMSs (μ = 0.6, Tc = 1.8 × 10⁸ K) in the presence of a homogeneous dark matter distribution with various densities ρχ. The red curves correspond to ρχ = 0 and to log ρχ [cgs] = −10, −9, …, −3 (from left to right); the orange curves to log ρχ/ρc = −10, −9, …, −3 (from left to right). The black, blue, and cyan lines are GENEC tracks for the indicated accretion rates (Haemmerlé et al. 2018a, 2019). The grey lines correspond to constant mass fractions of the convective core.
Current usage metrics show cumulative count of Article Views (full-text article views including HTML views, PDF and ePub downloads, according to the available data) and Abstracts Views on Vision4Press platform.
Data correspond to usage on the plateform after 2015. The current usage metrics is available 48-96 hours after online publication and is updated daily on week days.
Initial download of the metrics may take a while.